
High- and Medium-High-Technology Manufacturing
Key Messages
- Canada gets a “D” grade and ranks 13th out of 16 countries.
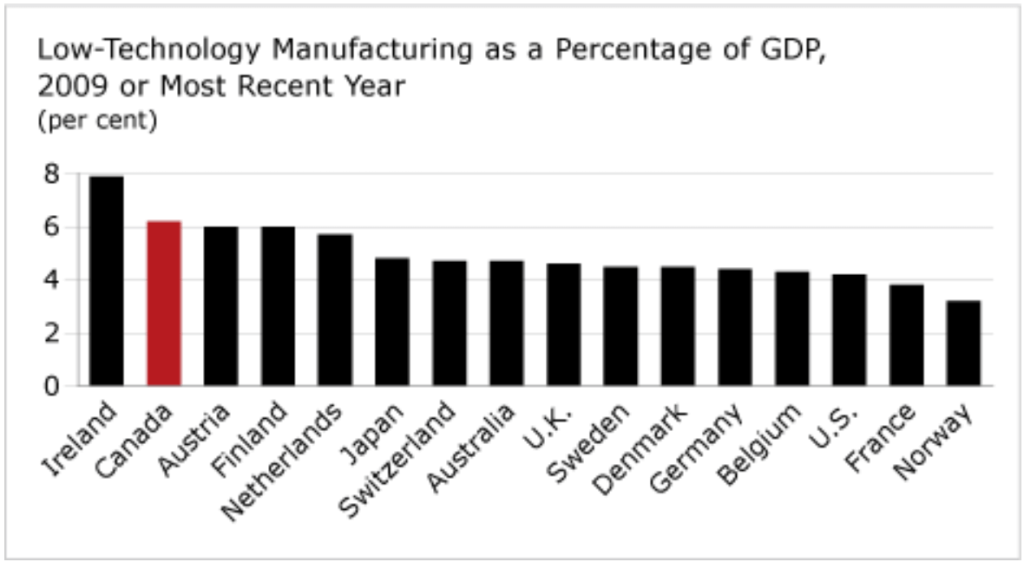
- Low-technology manufacturing accounts for 6.2 per cent of Canada’s GDP—four times more than high-technology manufacturing accounts for.
- Canada has earned “D”s for the past three decades.
Putting high- and medium-high-technology manufacturing in context
All sectors commercialize and use knowledge to some extent, but some do so more intensively than others. By measuring the share of high- and medium-high-technology manufacturing in GDP, we can gauge whether a country is a technology maker or simply a technology user.
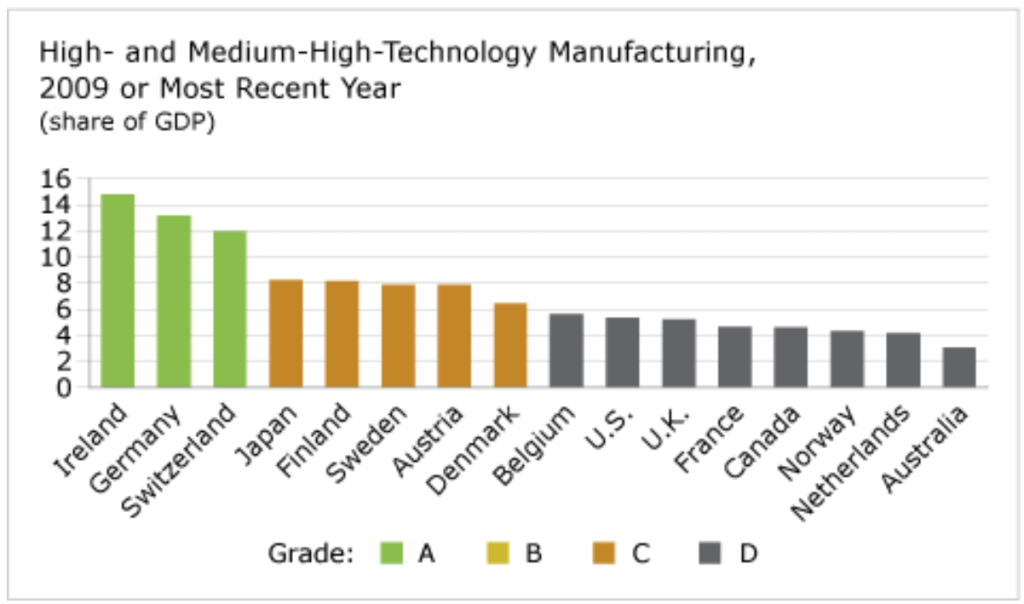
The past few decades have seen a general decline in the amount of technology manufacturing taking place in Canada and its peer countries. Of Canada’s peer countries, only Ireland, Germany, Switzerland, and Finland have maintained a substantial commitment to technology manufacturing. This reflects economic restructuring toward the use of global supply chains, in which emerging economic powers have taken over a growing share of the world’s manufacturing. More developed economies tend to be users or service providers—as shown by another report card indicator: knowledge-intensive services.
Is Canada keeping up with the rest of the class?
Canada earns a “D” and ranks 13th out of 16 countries, with 4.6 per cent of its GDP coming from high- and medium-high-technology manufacturing. Three countries earn “A”s:
- Ireland, which transformed itself into an export platform for technology manufacturers
- Germany, which has a long and successful history of supporting and protecting its main science and engineering companies
- Switzerland, which has strength in pharmaceuticals and instruments.
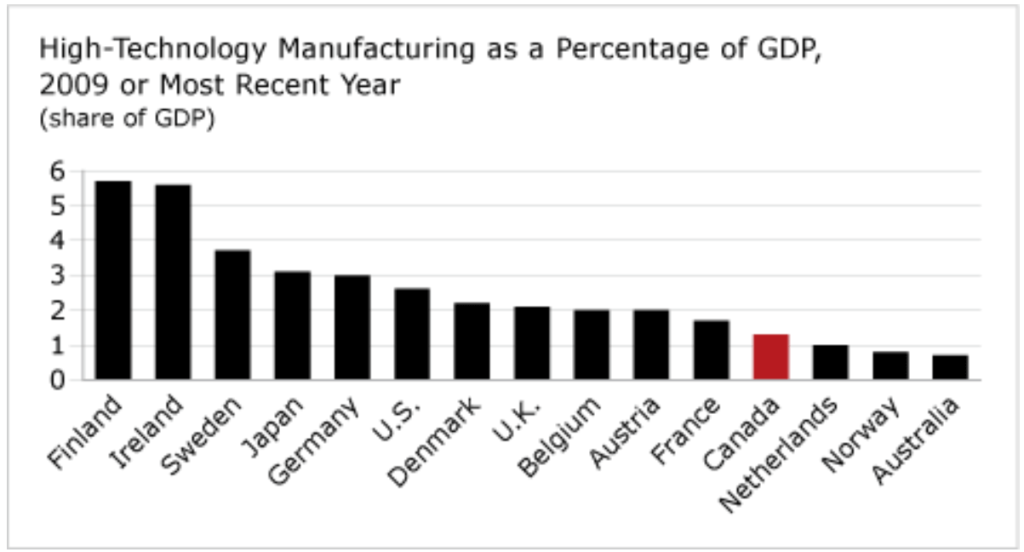
Canada’s ranking is 12th when high-tech manufacturing is ranked alone. High-tech manufacturing accounts for just 1.3 per cent of Canada’s GDP. In shifting from a manufacturing to a services economy, many countries aim to manage the change so the share of value added through high-technology manufacturing is the last to go. Canada, however, seems to be comfortably settled in its low- and medium-value-added niche. In fact, Canada ranks second of the peer countries in the share of GDP accounted for by low-value-added manufacturing.
Meanwhile, emerging market and high-performing Asian countries are rapidly increasing manufacturing value-added. (South Korea, China, and Singapore are the best examples.) The result is that Canada, a developed country, actually exports raw commodities to these and other countries in return for products with high value-added manufacturing.
This report card does not account for the service components of organizing and managing supply chains and operating the transportation and communications systems associated with them. For this, see the GDP share of knowledge-intensive services, in which Canada earns a “C” grade.
Is Canada’s relatively low performance a cause for concern?
This report card sheds light on two deep economic trends: First, it highlights that Canada and its peers are seeing a shift from manufacturing to services, which typifies an advanced economy. Although the shift is controversial, it is also inevitable, because many countries, especially in emerging markets, have a manufacturing labour force whose hourly productivity has become increasingly competitive.
At issue is whether expanding the services sectors will offer higher-productivity jobs for future economic sustainability. Some services sectors evidently do add value to Canada’s living standard. But Canada’s relative living standard (measured by income per capita) has grown more slowly than that of many of its peer countries. This indicates that Canada is not always effectively trading highly productive manufacturing jobs for high-value services jobs.
The second deep economic trend is that commodity production, powered by a commodity boom that has marked the first years of the 21st century, has become more central to the Canadian economy.
Canada and Norway, in particular, have been caught in the grip of both these trends leading away from manufacturing. However, Norway manufactures even less than Canada, because both trends—commodity exports and the shift of economic activity towards services—are proportionately greater in Norway than in Canada.
Is Canada’s performance in high- and medium-high-technology manufacturing improving?
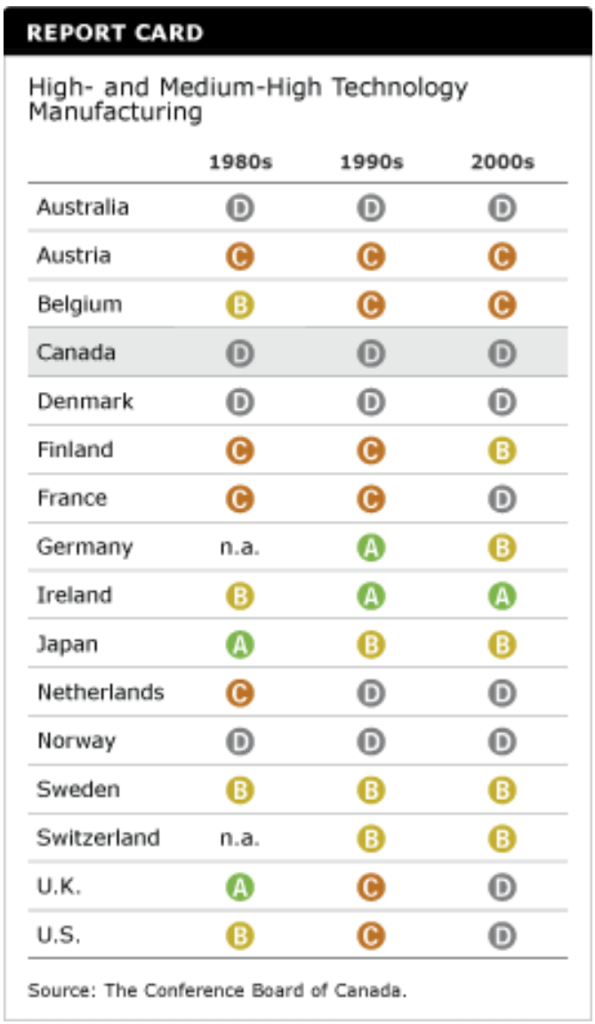
Canada has earned “D”s for the past three decades, as have Australia, Denmark, and Norway. Ireland moved up from a “B” to an “A” in the 1990s. The U.S. fell from a “B” in the 1980s to a “C” in the 1990s and then to a “D” in the 2000s.
Is technology manufacturing performance deteriorating in other countries?
Yes. The U.K., for example, has shed manufacturing activities as its financial services and oil exports have grown.
Another example is France. In 1980, high- and medium-high-technology manufacturing accounted for 8.3 per cent of GDP. This fell to 4.7 per cent in 2008.
Who is the class leader?
Ireland is the leader on this indicator. Ireland successfully transformed itself into an export platform for high-technology firms like IBM and Intel, although high- and medium-high-technology manufacturing as a share of GDP in Ireland has been falling in recent years—from 21.8 per cent in 2002 to 14.8 per cent in 2009.