
Business Enterprise R&D Spending
Key Messages
- Canada gets a “D” and ranks 15th out of 16 peer countries.
- Relative to their international peers, Canadian companies are poor R&D spenders—regardless of the business they’re in.
- To improve, Canadian business leaders must recognize that the risks of not spending on research and innovation are beginning to outweigh the risks of spending and innovating.
Why is business spending on R&D important to innovation?
Business enterprise R&D spending (sometimes referred to as BERD) is an important indicator of business commitment to innovation. Although such spending is not a direct measure of innovation performance—because such investments can be poorly selected and valuable results are not guaranteed—the development of new or improved products, processes, and services frequently requires R&D efforts. R&D spending “signals a firm’s commitment to the systematic generation and commercial application of new ideas,” according to the Council of Canadian Academies’ Expert Panel on Business Innovation.1
Indeed, R&D spending indicates that a firm is serious about exploring or generating new ideas with a view to developing those ideas into new or improved products, services, or processes.
Moreover, research shows that R&D spending is associated with productivity and GDP growth. A multi-country study by the OECD found that a “sustained increase of 0.1 percentage point in a nation’s BERD to GDP ratio would eventually translate to a 1.2 per cent higher GDP per capita, other things being equal.”2
Thus, BERD provides a useful, albeit imperfect, proxy for business innovation performance.
How does Canada’s performance on business R&D spending compare to its peers?
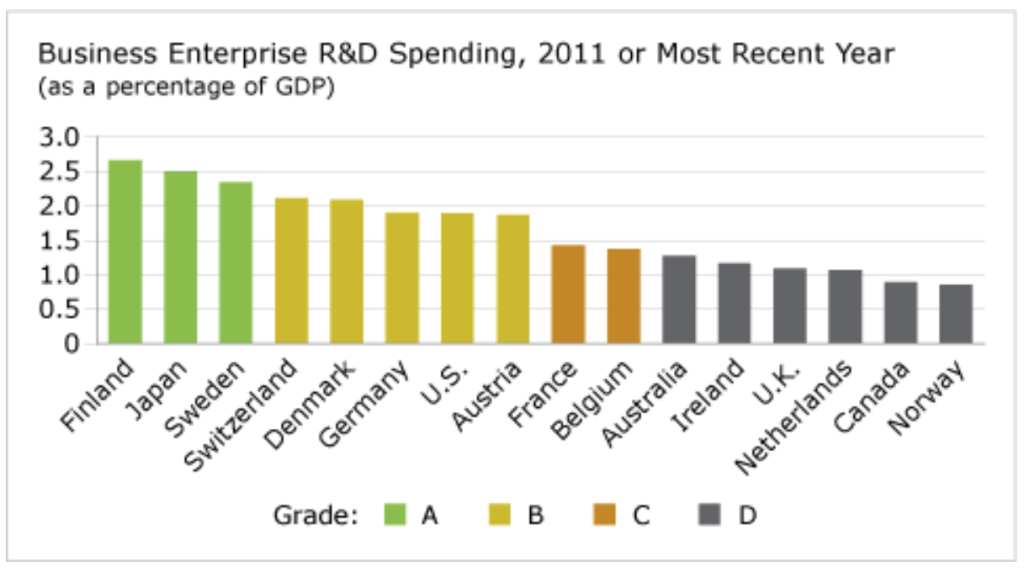
Canada is a weak performer on BERD. It gets a “D” grade and ranks 15th out of 16 peer nations. Moreover, Canada has been a “D” performer since the 1980s. Although Canadian businesses projected R&D spending of $15.6 billion in 2011, as a group they spend much less than international peers (when BERD is measured as a percentage of GDP).3
BERD spending in the U.S., for example, is twice as high as in Canada. And Canadian businesses spend only a third (as a percentage of GDP) of what businesses in Finland spend on R&D. In fact, not only does Canada lag its competitors on BERD, it also falls below the OECD average.4
Is Canada’s weak performance on BERD simply a function of the industrial composition of the Canadian economy? Canada’s economy is weighted more toward resource-related companies than the economies of many peers, and the resource sector tends to spend less on R&D than other sectors. However, analysis conducted by the Expert Panel on Business Innovation found that “generally lower Canadian R&D spending within the same sectors in both the United States and Canada accounts for a greater portion of the gap [in BERD between the two countries]…than does Canada’s adverse sector mix—i.e., the greater weight in Canada’s economy of resource-related and other activities that have inherently low R&D spending.”5 In short, with few exceptions, Canadian businesses across all sectors have lower BERD intensity than their American competitors.
Who are the leaders on the BERD report card?
Japan and Sweden are high performers on BERD and have been for decades. But the top spot is claimed by Finland—a remarkable achievement that was not foreseen two decades ago. In the 1980s, Finland was ranking between only 9th and 11th out of the 16 ranked countries. As recently as the 1990s, Finland was a middling performer on BERD, ranking 8th at the beginning of the decade and edging up to 5th or 6th by the mid-1990s. By the 2000s, however, Finland was quickly becoming a world-leader in BERD performance. With BERD intensity of 2.37 per cent as a percentage of GDP, Finland ranked second—behind only Sweden—in 2000 and climbed into first place by 2008 with BERD intensity of 2.75 per cent.
How did a poorly ranked, “C”-grade performer become the top-ranked, “A” performer among its international peers? The story appears to be a case of intense, coordinated action in the face of a crisis. In 1991, the Finnish economy faced a severe economic crisis owing to “a near collapse of the domestic banking system and a massive export market disruption due to the disintegration of the USSR.”6
In response, Finnish government and business leaders—led primarily by the information and communications technology (ICT) sector—“committed to transform its economy into one of the most technologically advanced in the world” by increasing and focusing spending and activity to “nurture globally oriented national companies and sectors.”7
The increase in BERD intensity is an indicator of just how serious and successful the Finns have been in this endeavour.
Has Canada’s performance on this report card improved over time?
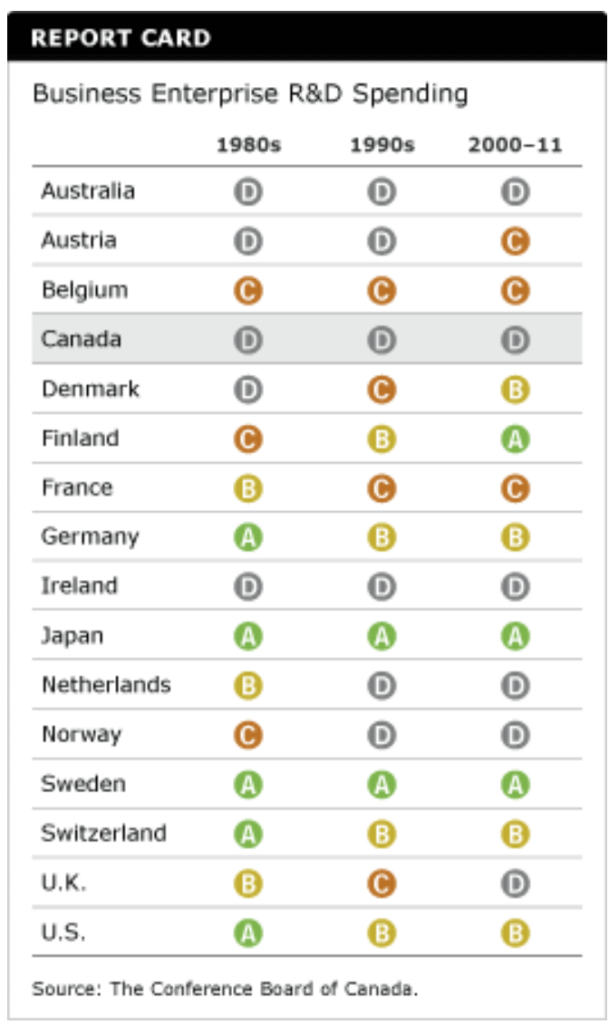
Unfortunately, Canada has not experienced anything like Finland’s impressive improvement in the BERD report card over time. Canada has been a consistent “D” performer on BERD intensity, ranking no better than 11th out of 16 countries over the past three decades.
To be sure, Canada’s BERD intensity improved from the 1980s to the early 2000s, moving from a low of 0.59 per cent in 1981 to a high of 1.29 per cent in 2001. But the dot-com bust in the early 2000s initiated a steady decline in R&D spending by Canadian ICT firms and a levelling off of spending in sectors, such as pharmaceuticals, that had been posting phenomenal increases in previous years. Overall, between 2001 and 2011, BERD intensity in Canada fell from 1.29 per cent to only 0.89 per cent.
What can Canada do to improve its grade on this report card?
The experience of Finland shows that decision-makers often wait until the moment of crisis before being spurred to action. Although Canada faces an uncertain economic future, there does not appear to be the same sense of crisis that has motivated others to act. In fact, Canada’s generally good economic performance may be contributing to a sense of complacency about the future and an aversion to risks that stray too far from the status quo.
But the situation may be changing. In the face of increasing global competition and persistent demographic and economic challenges, many business leaders in Canada may be waking up to the fact that the risks of not spending on research and innovation are beginning to outweigh the risks of spending and innovating. Gradually introducing more competition—for example, by signing new trade agreements and eliminating lingering protectionist measures—while providing focused R&D incentives (such as tax credits) to key sectors of the economy may contribute to higher R&D spending by Canadian businesses.
Footnotes
1 Expert Panel on Business Innovation, Innovation and Business Strategy: Why Canada Falls Short (Ottawa: Council of Canadian Academies, 2009), 49–50.
2 Expert Panel on Business Innovation, Innovation and Business Strategy: Why Canada Falls Short (Ottawa: Council of Canadian Academies, 2009), 50; citing OECD, The Sources of Economic Growth in OECD Countries (Paris: OECD, 2003).
3 Statistics Canada, Gross Domestic Expenditures on Research and Development in Canada (Ottawa: Ministry of Industry, 2012), 6.
4 Expert Panel on Business Innovation, Innovation and Business Strategy: Why Canada Falls Short (Ottawa: Council of Canadian Academies, 2009), 54.
5 Ibid., 6. For details, see Annex III—Analysis of R&D Intensity by Sector.
6 Ibid., 55.
7 Ibid., 55.