
Connectivity
Key Messages
- Relative to international peers, most provinces are middling to poor performers on connectivity.
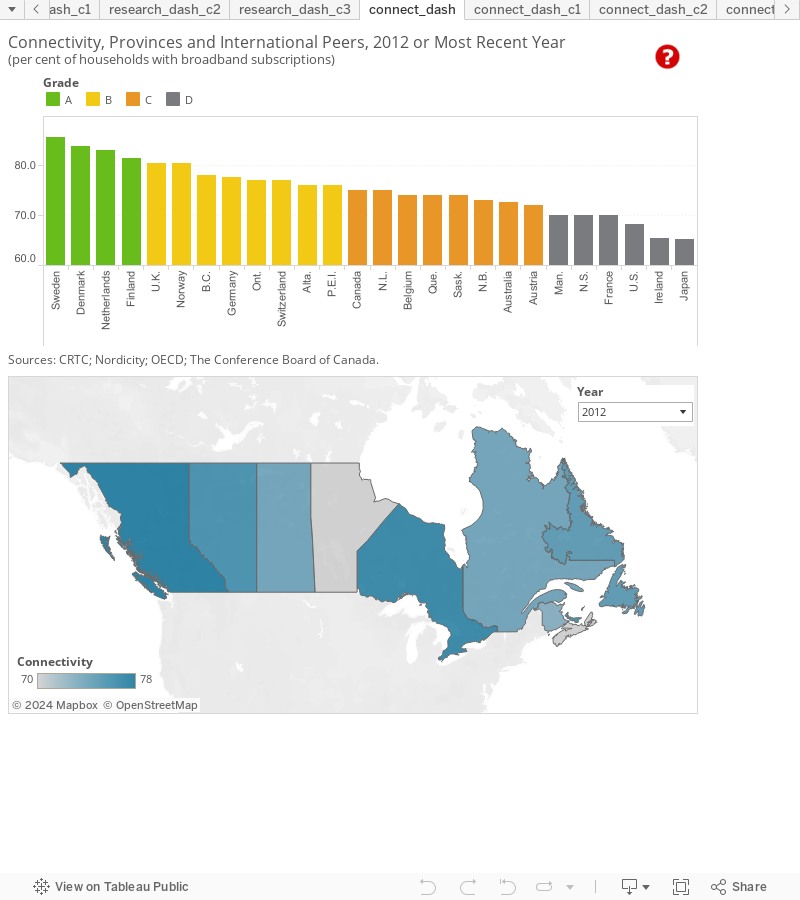
- In B.C., 78 per cent households have broadband subscriptions, earning the province a “B”—the top ranking among the provinces and seventh place among international peers.
- With household broadband subscription rates five percentage points below the Canadian average, Nova Scotia and Manitoba score “D” grades and are the lowest-ranking provinces.
Why is connectivity important to innovation?
The Internet has become critical infrastructure for business, government, science, the arts, education, and social interaction generally. Organizations and individuals depend on the Internet to exchange ideas and information, to sell and buy goods and services, to aid education, and to socialize. In these and other ways, the Internet supports innovation and commercialization activities, in terms of both developing capacity for innovation and implementing, marketing, and selling the results of innovation. As access to the Internet spreads, not only are innovators better enabled to share ideas and collaborate across distances, but access to potential markets and customers is improved when those end-users are more connected as well.
How is connectivity measured?
Connectivity is measured as the share of households with fixed broadband subscriptions. Although availability is higher—reaching 100 per cent in some regions—what matters is whether people are in fact using that capacity. A measure of subscriptions is therefore a better measure than availability.
Access to the Internet can be through either fixed broadband (including digital subscriber lines or DSL, cable modem, and fixed wireless) or mobile broadband (including wireless communication standards such as 3G or 3G equivalent, HSPA+, and LTE). Ideally, comparable data would exist for both fixed and mobile subscriptions, as well as for Internet penetration among businesses in addition to households. However, the share of households with fixed broadband subscriptions provides a reasonable measure of Internet use generally.
How do the provinces rank relative to international peers?
Most provinces are middling to poor performers on connectivity relative to international peers. With 78 per cent of its households with broadband subscriptions, B.C. earns a “B” and ranks first among the provinces and seventh among international peers. B.C. trails six countries, including Sweden (86 per cent connectivity), Denmark (84 per cent), the Netherlands (83 per cent), and Finland (81 per cent)—all four of which score “A”s.
Along with B.C., Ontario (77 per cent), P.E.I. (76 per cent), and Alberta (76 per cent) all rank above the national average and earn “B” grades.
Newfoundland and Labrador, Quebec, Saskatchewan, and New Brunswick, along with Canada as a whole, score “C” grades, with their shares of broadband subscriptions ranging from 73 to 75 per cent. And with household broadband subscription rates of 70 per cent, Nova Scotia and Manitoba score “D” grades, joining France (70 per cent), the U.S. (68 per cent), Ireland (65 per cent), and Japan (65 per cent) at the back of the class.
How do the provinces rank relative to each other?
B.C. is the highest-ranking province, followed by Ontario, P.E.I., and Alberta. All four provinces score “B” grades and place above the Canadian average on connectivity. Newfoundland and Labrador, Quebec, Saskatchewan, and New Brunswick have household broadband subscription rates at or slightly below the Canadian average and earn “C” grades. With household broadband subscription rates of 70 per cent—five percentage points below the Canadian average—Nova Scotia and Manitoba score “D” grades and are the lowest-ranking provinces.
Although the difference between the top- and bottom-performing provinces is only 8 percentage points, given that Canada’s top-performing province, B.C., achieves only a “B” grade relative to international peers, there is substantial room for improvement by all provinces, especially Nova Scotia and Manitoba.

Does price matter?
Prices for broadband subscription services tend to be higher in the Atlantic provinces than in other provinces. However, there does not appear to be a relationship between prices and subscription rates across provinces.1 For example, while Manitoba has one of the lowest broadband subscription price averages of all provinces, it ranks last in subscriptions. By contrast, P.E.I. has one of the highest price averages, but scores a “B” and ranks third among provinces on connectivity.
Similarly, price differences do not appear to explain subscription rate differences between international peers.2 For example, although Japan and France have the lowest median Internet broadband purchase prices of the peer countries, they earn “D”s for connectivity. By contrast, while Switzerland and Germany have the third- and fourth-highest median broadband prices, they have above-average broadband subscription rates and earn “B”s for connectivity.
Although subscription rate differences across regions may not be explained by price differences, the fact that between 22 and 30 per cent of Canadian households, depending on province, do not have access suggests that for a sizable minority of consumers, price may be a consideration.
Are there differences in broadband speed across provinces and international peers?
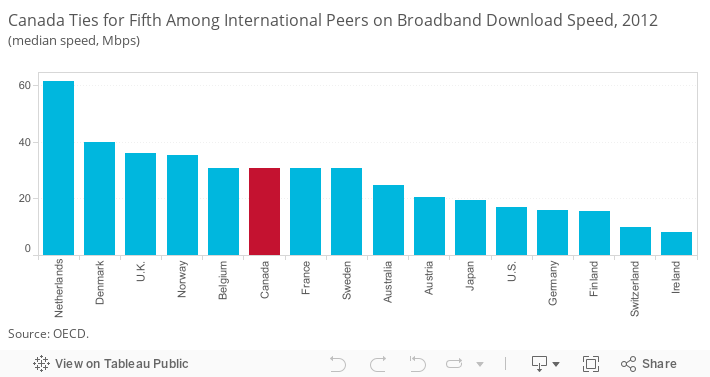
Among the 16 peer countries, Canada’s median broadband download speed of 31 Mbps ties for 5th with Belgium, France, and Sweden.3 Although this is much slower than the Netherlands’ median broadband speed (61 Mbps), it is not much slower than the median speeds of Denmark (40 Mbps), the U.K. (36 Mbps), and Norway (35 Mbps). Moreover, Canada’s median broadband download speed is nearly twice as fast as that of its neighbour, the U.S. (17 Mbps).
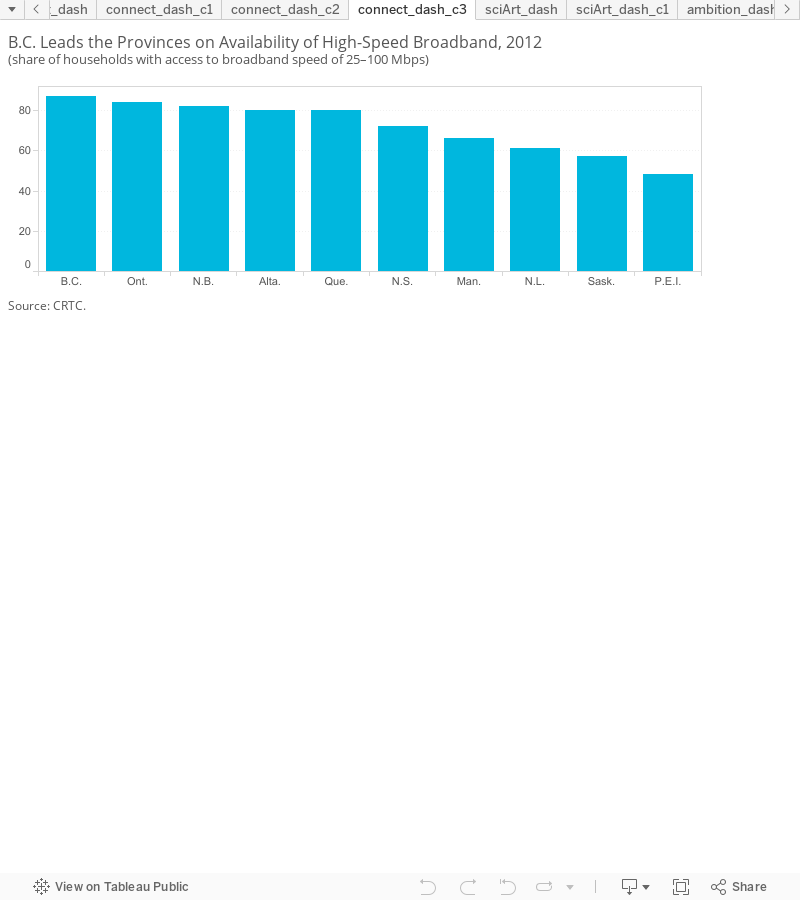
Although comparable data for the provinces are not available, another measure of speed—specifically, household availability of broadband at speeds of 25 to 100 Mbps—reveals significant differences in capacity across provinces. Whereas 87 per cent of B.C. households have access to broadband with download speed between 25 and 100 Mbps, only 48 per cent of P.E.I. households have such access. Households and businesses that have access to higher download speeds will be able to share more information more quickly and collaborate more effectively, giving them an innovation advantage.
How can provinces increase broadband subscription rates?
All provinces have room for improvement. Increasing subscription rates would likely require strategies that address costs, as well as geographic and infrastructure challenges.
Although price does not explain variation in connectivity across provinces, it can help explain why subscription rates are below 80 per cent for all provinces. Canadian households at the lower end of socio-economic status are less likely to be online, leaving some students and workers out of the effort to enhance Canada’s capacity for innovation.4 According to Statistics Canada, while “97 per cent of Canadians in the top income quartile have access to the Internet in their homes,” access falls to 54 per cent among those in the bottom income quartile.5 Reaching disadvantaged Canadians who have been left out of the Internet revolution will be a key factor in improving provinces’ connectivity performance overall.
Another factor is the digital divide between urban and rural Canadians—although this is diminishing in importance in light of new technologies. With some exceptions, provinces whose populations are more concentrated in urban areas tend to be more connected than provinces whose populations are more rural.6 Moreover, within provinces, rural and remote areas tend to face greater challenges connecting people to the Internet than is the case for urban areas. Progress on both price and access for rural communities could result in a higher uptake of broadband Internet subscriptions and therefore higher Canadian connectivity.
Footnotes
1 Calculations based on data from CBC News, Broadband Costs in Canada.
2 Calculations based on data from Organisation for Economic Development and Co-operation, OECD Broadband Portal.
3 Ibid.
4 Catherine A. Middleton and Christine Sorensen, “How Connected Are Canadians? Inequities in Canadian Households’ Internet Access,” Canadian Journal of Communication 30 no. 4 (2005), 463; John Lawford and Alysia Lau, No Consumer Left Behind: A Canadian Affordability Framework for Communications Services in a Digital Age (Ottawa: Public Interest Advocacy Centre, 2015).
5 Cited in Michael Geist, “Why Canada’s Digital Divide Persists,” The Tyee, April 9, 2013.
6 Conference Board calculations based on provincial connectivity data and Statistics Canada, National Household Survey—Population, Urban and Rural, by Province and Territory; CRTC, Communications Monitoring Report 2013 (Ottawa: CRTC, 2013), Chapter 6.