
Disabled Income
Key Messages
- Canada earns an “A” grade and ranks 8th out of 16 peer countries.
- Canada relies more on labour market integration of people with disabilities than on income transfers.
- The employment rate of people with disabilities is lower in Canada than in 8 of the 16 peer countries.
Putting income of people with disabilities in context
The Conference Board’s goal is to measure quality of life for all Canadians. Self-sufficiency, which is promoted by ensuring active participation by all people in a country’s economy and its society, is an important element of this. Two indicators reflect self-sufficiency: jobless youth and disabled income.
The disabled income indicator examines the income of people with disabilities relative to those without disabilities in each of the peer countries. While the 17 peer countries are among the wealthiest in the world, with high levels of income per capita, the situations of vulnerable sub-populations are often masked by the overall numbers. In general, people with disabilities have lower incomes than people without disabilities, have a higher risk of poverty, are less likely to be employed, and are at risk of social exclusion.
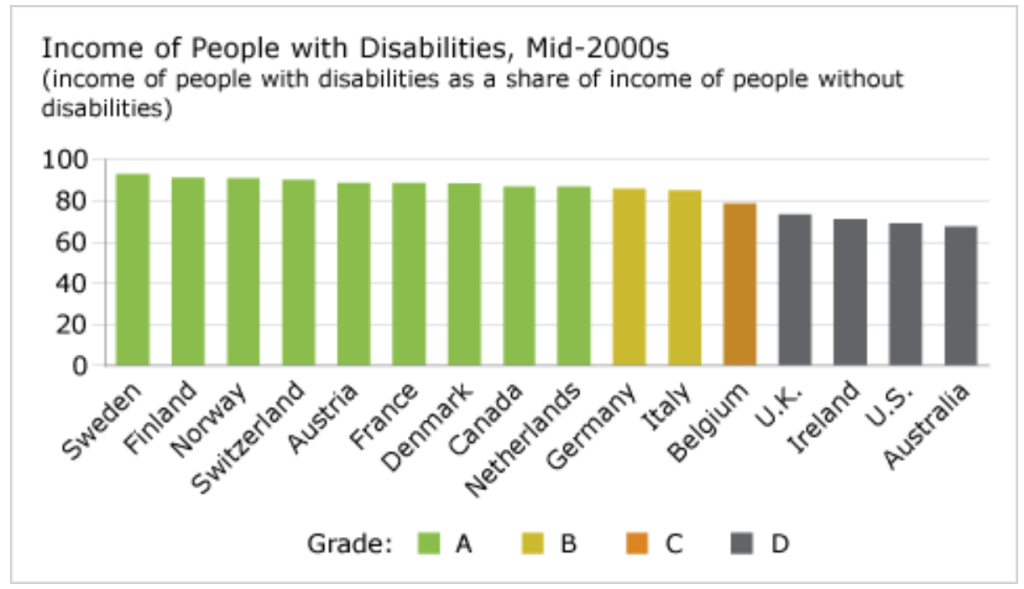
Do Canadians with disabilities earn more than peers in other countries?
In Canada, the income of people with disabilities is 87 per cent of that of people without disabilities—giving Canada an “A” rating on this indicator. This income proportion is significantly higher than that in Australia (68 per cent) and the U.S. (69 per cent), but lower than in Sweden (93 per cent).
Why do the Nordic countries do well on this indicator?
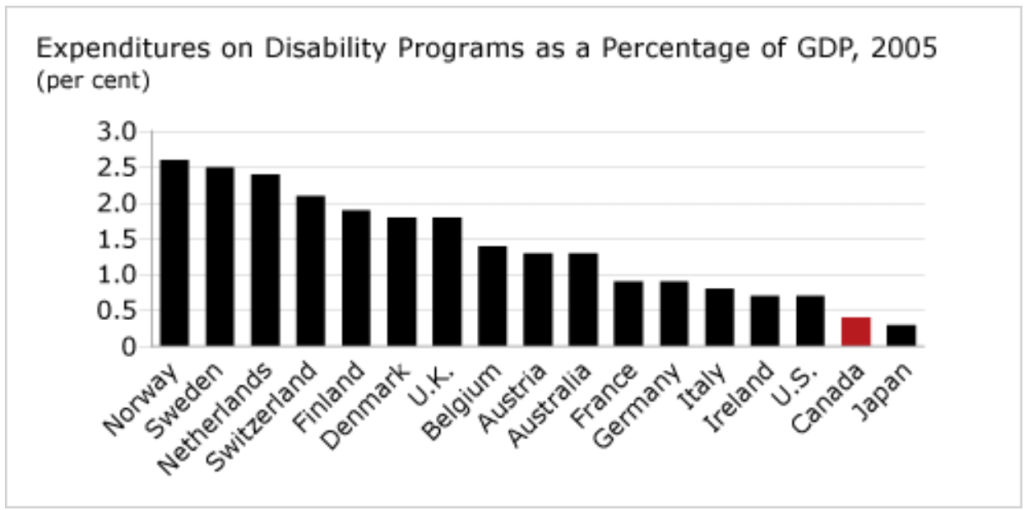
The high relative income of people with disabilities in Sweden and other Nordic countries is generally attributed to a system of generous cash benefits provided to those who need them.
Norway spent 2.6 per cent of gross domestic product (GDP) on disability programs in 2005. Canada spent only 0.4 per cent, the second-lowest proportion among the peer countries.
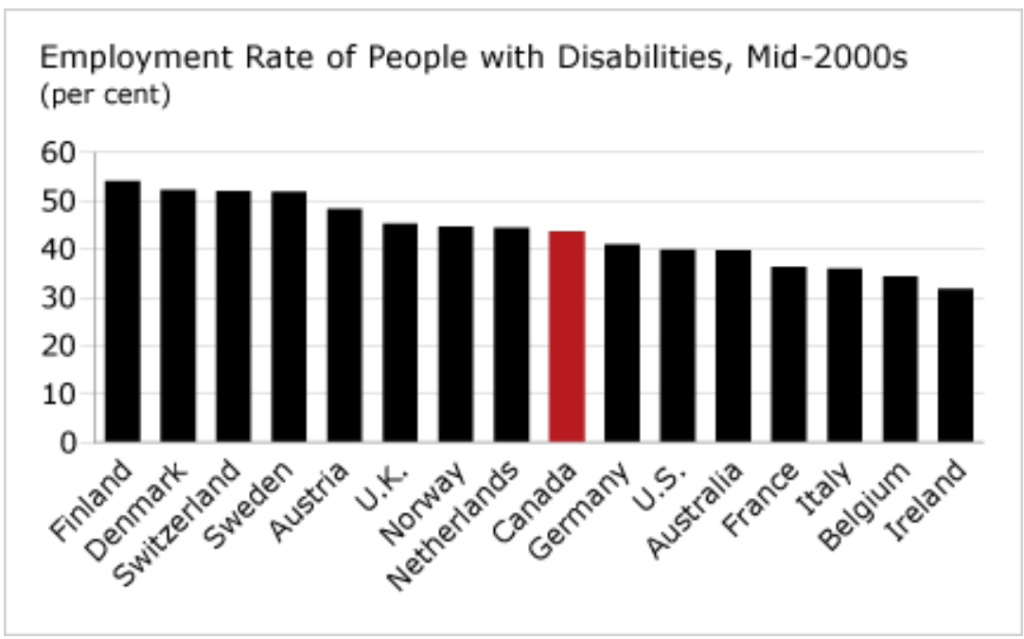
How does Canada fare on the employment of people with disabilities?
The employment rate of people with disabilities—a mark of self-sufficiency and inclusion—is lower in Canada than in 8 of the 16 peer countries for which data are available. In 2005, 44 per cent of working-age people with disabilities were employed in Canada. The best-performing peer country was Finland, with a 54 per cent employment rate; the worst was Ireland, with a rate of 32 per cent.
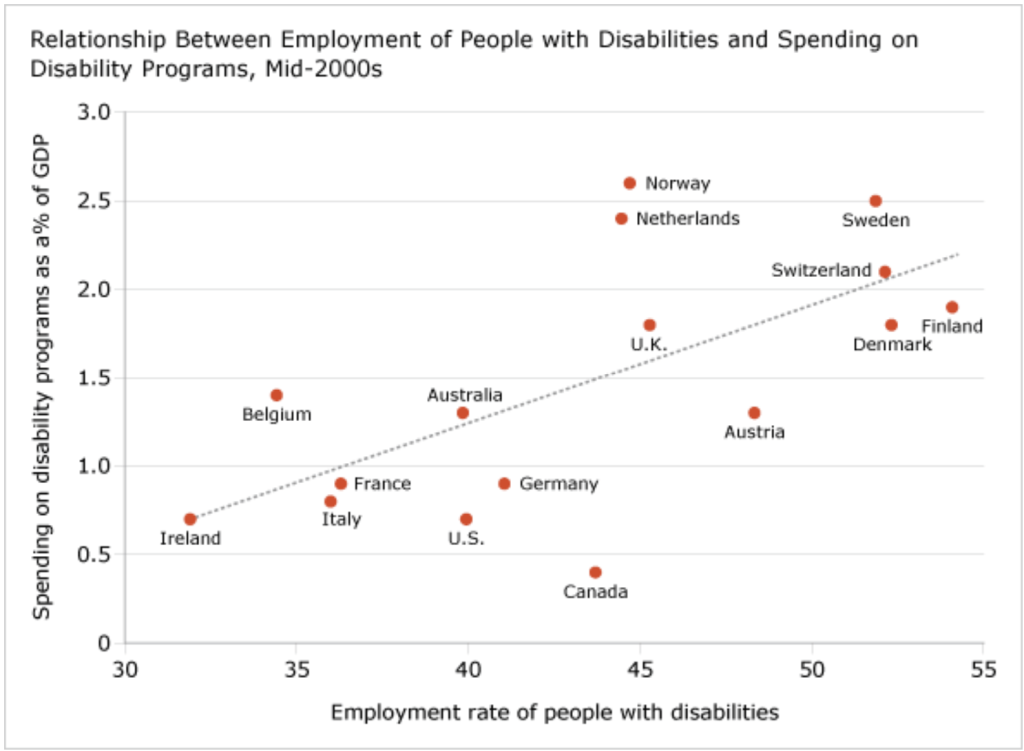
Is there a relationship between spending on disability programs and the employment rate of people with disabilities?
The success of the Nordic system of disability protection has been questioned because of their reliance on cash benefits more than employment integration (through regulations that ensure accessibility and combat discrimination).1
Despite this criticism, the employment rate of people with disabilities is high in the Nordic countries. As shown in the diagram below, there appears to be a positive relationship between spending on disability programs and employment success. Canada, however, seems to be a bit of an anomaly. The diagram shows that Canada spends a relatively low proportion of gross domestic product (GDP) on benefits but boasts a higher employment rate than seven countries that spend more.
So, is spending more the answer?
Disability benefit programs are very costly. In most peer countries, disability-related spending (as a percentage of GDP) in 2005 was higher than unemployment-related spending. While this is not the case in Canada, the aging of the Canadian population will likely result in increased disability spending.
However, the goal should be to ensure that Canadians with disabilities are not socially excluded. Because unemployment increases the risk of social exclusion, spending focused on programs to help people with disabilities integrate into the labour market is preferred over cash transfers. Of course, there will always be some people who, for whatever reason, are unable to work, and they should be assured an adequate income.
What are peer countries using: cash benefits or employment integration?
OECD countries show marked differences in their approaches to ensuring financial self-sufficiency for people with disabilities. Some rely more on compensation through income transfers. Others are more active in ensuring that people with disabilities can successfully integrate into the labour market.
The chart below maps two indexes for the 13 comparator countries included in the OECD’s analysis for 2000. The Index of Compensation takes into account 10 policy parameters related to the extent of coverage of the benefit system, levels, and duration. The Index of Integration measures 10 policy parameters related to access to employment and training programs, work incentives, and the prevalence of subsidized employment programs.
For each index, the 10 parameters are each ranked on a scale of 0 to 5, meaning that the top score on each index is 50. A high score on the Index of Compensation means that the country provides more support to people with disabilities. A high score on the Index of Integration means that the country has a strong focus on integrating people with disabilities into the workforce.2
The chart shows that Canada, the U.K., and the U.S. provided the least amount of financial support (compensation) to people with disabilities relative to their peer countries. Denmark and Germany focused strongly on policies that promoted employment (integration). Norway and Sweden used both policy tools, characterized by generous disability compensation system and a strong focus on integration.
Over time, however, most OECD countries have strengthened their integration policy elements and made their compensation policies less generous. The OECD states that the transformation of disability schemes from passive benefits to active support systems that promote work is promising, but that more reform is needed to promote employment integration. Reforms suggested by the OECD include:
- introducing and fostering anti-discrimination legislation
- increasing employers’ obligations toward people with disabilities
- streamlining administration and individualization of case management
- increasing work incentives for people with disabilities3
What can employers do to tap into the talents of people with disabilities?
The Conference Board has argued that people with disabilities are a relatively untapped reservoir of talent in Canada. The Board published a comprehensive report aimed at helping employers hire people with disabilities and integrate them into their workplaces. It contains practical advice on everything from pre-employment considerations through recruitment and selection, appropriate modifications to accommodations, and workforce education.
Fitting the Work to the Worker: Recruiting, Engaging, and Retaining Employees with Disabilities, Ottawa: The Conference Board of Canada, 2010.
Beyond Benefit Webinar: Absence and Disability Management, Ottawa: The Conference Board of Canada, 2010.
Beyond Benefits II: Disability Plans and Absence Management in Canadian Workplaces, Ottawa: The Conference Board of Canada, 2010.
Maximizing Human Capital: Employees with Disabilities—Are New Entrants Really Ready to Work?, Ottawa: The Conference Board of Canada, 2009.
Tapping the Talents of People with Disabilities, Ottawa: The Conference Board of Canada, 2001.
Footnotes
1 B. Hvinden, “Nordic Disability Policies in a Changing Europe: Is There Still a Nordic Model?” Social Policy and Administration, 38 (2004), 170–189.
2 OECD, Sickness, Disability and Work: Breaking the Barriers—Norway, Poland and Switzerland (Paris: OECD, 2006), 146.
3 Michael Förster, “From Disability to Ability: Policy Challenges and Trends in OECD Countries,” Presentation by the OECD Directorate for Employment, Labour and Social Affairs, Social Policy Division, January 17, 2007.
Society Indicators
See discussions on other indicators