
Jobless Youth
Key Messages
- Saskatchewan is the top-performing province on jobless youth and the only one to earn an “A” grade, ranking 4th among 25 comparator regions.
- The Atlantic provinces have the highest proportions of jobless youth among the provinces and are among the lowest-ranked jurisdictions internationally.
- Canada earns a “B” and ranks 9th out of 15 peer countries, with 14.8 per cent of those aged 20–24 neither in school nor working.
Putting jobless youth in context
The jobless youth indicator measures the proportion of people 20 to 24 years old who are not in education, employment, or training. Ensuring that young adults are either in school or working is a policy priority for countries in the Organisation for Economic Co-operation and Development (OECD). Indeed, governments recognize that in the absence of adequate employment and scholastic opportunities, young people do not acquire the skills to ensure their future economic autonomy, and this can have “serious long-term effects on health, fertility and crime, and eventually endanger social cohesion.”1
Young adults who are neither in school nor working face an increased risk of poverty and social isolation, which present significant costs to individuals, communities, and societies. Therefore, finding ways to improve labour market participation and outcomes for young adults is beneficial not only for the economy but also for society as a whole.
Jobless youth rates may also reflect personal choices—for example, choosing to take time off for travel or to volunteer. Nonetheless, this indicator is an important measure of social cohesion as it brings to light the potential vulnerability of some youth.2
How is jobless youth measured?
Jobless youth is the percentage of people between the ages of 20 and 24 who are neither attending school nor engaged in the labour market, as a proportion of the total population of the same age cohort.
An important caveat to how jobless youth is measured is that unemployment rates reflect data collected at one point in time during the first quarter of each calendar year. Therefore, the measure does not take into account the duration of youth unemployment. For example, it is possible that, because of the point at which the survey was administered, people classified as being unemployed were transitioning from school to work and not experiencing long-term unemployment. Jobless youth also includes young adults who were not available to start work the week they were surveyed and therefore not actively seeking employment.
How do Canada and the provinces rank relative to international peers?
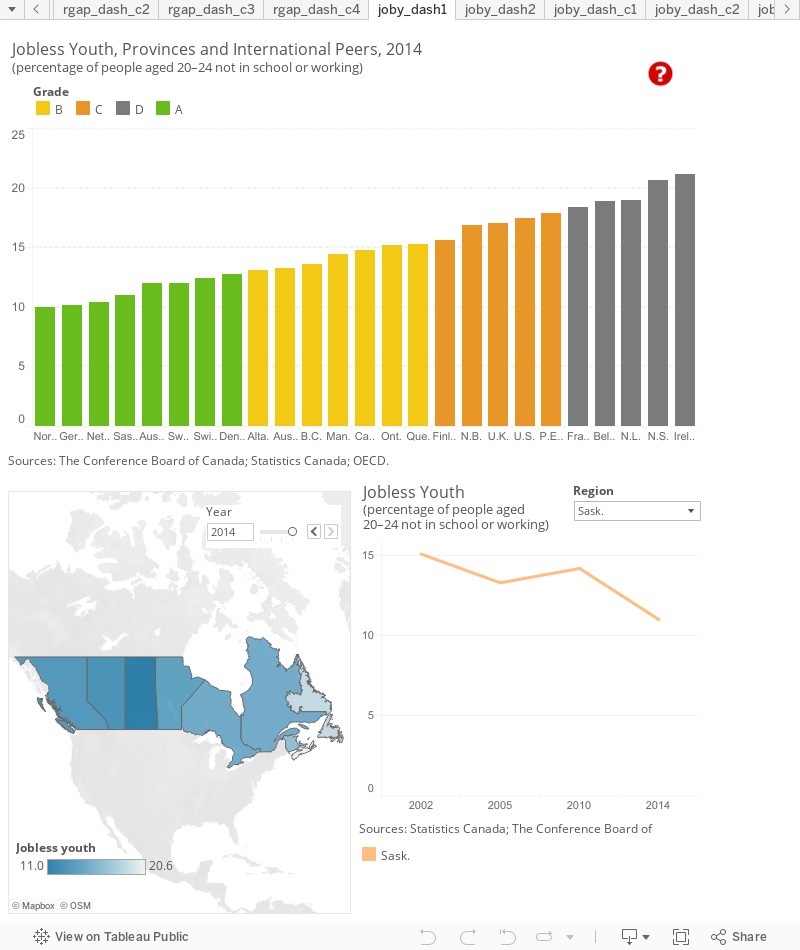
Saskatchewan is the top-ranked province, with a jobless youth rate of 11 per cent, and is the only province to earn an “A” grade. This province is 4th among the 25 comparator jurisdictions (comparable date for Japan are not available), behind Norway (10 per cent), Germany (10.1 per cent), and the Netherlands (10.4 per cent).
Alberta gets a “B” grade (13.1 per cent). The province is ranked 9th overall, behind Austria and Sweden (both at 12 per cent), Switzerland (12.4 per cent), and Denmark (12.7 per cent) and just ahead of Australia (13.2 per cent). B.C. (13.6 per cent) and Manitoba (14.4 per cent) also get “B” grades and rank 11th and 12th, respectively, just above the national average.
Overall, Canada gets a “B” on jobless youth and ranks 9th among the 15 peer countries—14.8 per cent of people aged 20 to 24 years old are neither in school nor working.
Ontario (15.2 per cent) and Quebec (15.3 per cent) have jobless youth rates just above the national average and also get “B” grades. These two provinces occupy the 14th and 15th positions, just ahead of Finland (15.6 per cent).
New Brunswick (16.9 per cent) is a “C” performer, ranking 17th overall, just ahead of the U.K. (17 per cent). P.E.I. (17.9 per cent) also gets a “C,” ranking 20th, just behind the U.S. (17.5 per cent) and ahead of both France (18.4 per cent) and Belgium (18.9 per cent).
Newfoundland and Labrador (19 per cent) and Nova Scotia (20.6 per cent) are the lowest-ranking provinces and get “D” grades, in 23rd and 24th place, respectively. They outperform only Ireland (21.2 per cent).
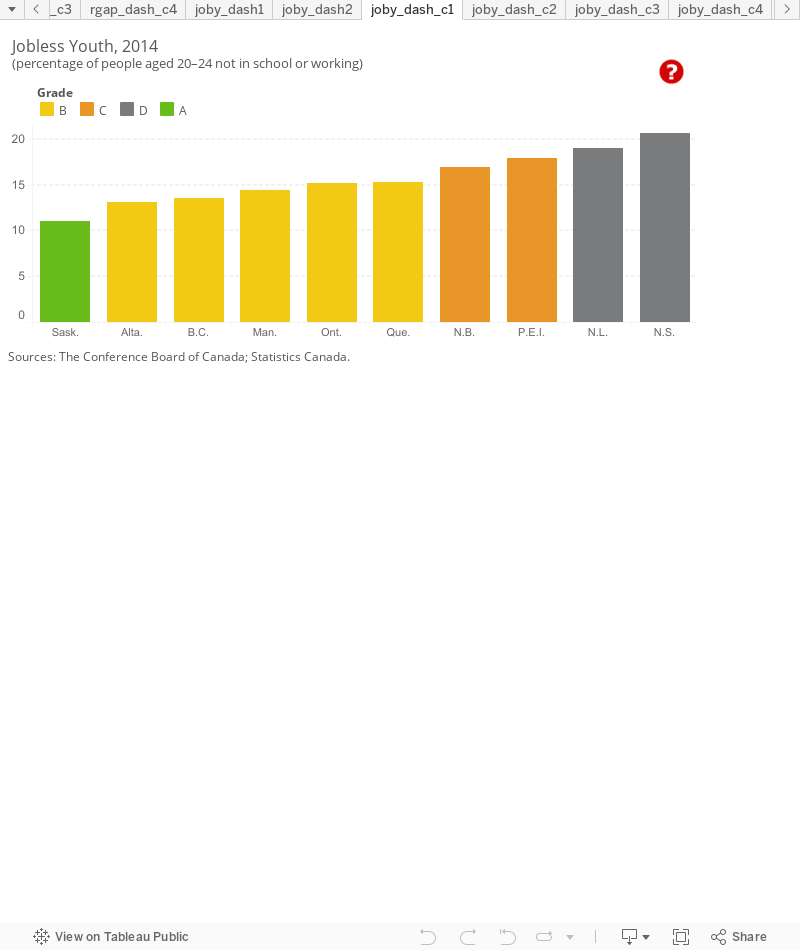
How do the provinces rank relative to each other?
The Western provinces do best, while the Atlantic provinces rank the lowest among Canadian provinces. These results parallel overall labour market outcomes—the Western provinces typically have low unemployment overall (although unemployment has increased in these provinces in recent years because of the commodity shock), while the Atlantic provinces typically have higher levels of unemployment. Ontario and Quebec are in the middle of the pack.
Saskatchewan (11 per cent), Alberta (13. 1 per cent), B.C. (13.6 per cent), and Manitoba (14.4 per cent) each have smaller proportions of jobless youth than the Canadian average (14.8 per cent).
Nova Scotia (20.6 per cent), the lowest-ranked province, has a youth joblessness rate nearly twice as large as that of top-ranked Saskatchewan.
How do the territories rank relative to international peers?
The Yukon is a “B” performer, with a jobless youth rate of 15.5 per cent (although this rate should be viewed with caution because of high sampling variability in the Yukon).3 This proportion is slightly larger than the proportion of jobless youth in Ontario and Quebec.
In the Northwest Territories and Nunavut, 23.8 and 51.8 per cent, respectively, of young adults between the ages of 20 and 24 were neither in school nor working in 2014. With the highest jobless youth rates among all jurisdictions, these two territories are “D–”performers.
Notably, in Nunavut, the 20- to 24-year-old age cohort is proportionally the largest group among the working-age population. Given that this group makes up just over 14 per cent of working-age adults,4 a 51.8 per cent joblessness rate (over 1,700 people) can have a significant impact on socio-economic performance in this region. However, the jobless youth figures may also be higher in Nunavut because youth are occupied with traditional activities such as hunting and fishing—activities that are important to Aboriginal wellness, identity, and livelihood but not captured in conventional labour market information.
The territories are not included in the overall benchmarking rankings because data for the territories are not available for key indicators included in the society report card. However, the Conference Board is committed to including the territories in our analysis, and so we provide information on territorial performance when data are available.
How have jobless youth rates in the provinces and territories changed over time?
Between 2002 and 2014, Canada’s overall jobless youth rate decreased by 0.5 percentage points—from 15.3 to 14.8 per cent.
The largest decrease was in P.E.I., where the share of 20 to 24 year olds not in school or working dropped by 5.9 percentage points, from 23.8 per cent in 2002 to 17.9 per cent in 2014.
Nunavut had the largest overall increase in youth joblessness—the share of 20 to 24 year olds not in school or working rose by 12.2 percentage points, from 39.6 per cent in 2005 (2002 data were not available) to 51.8 per cent in 2014.
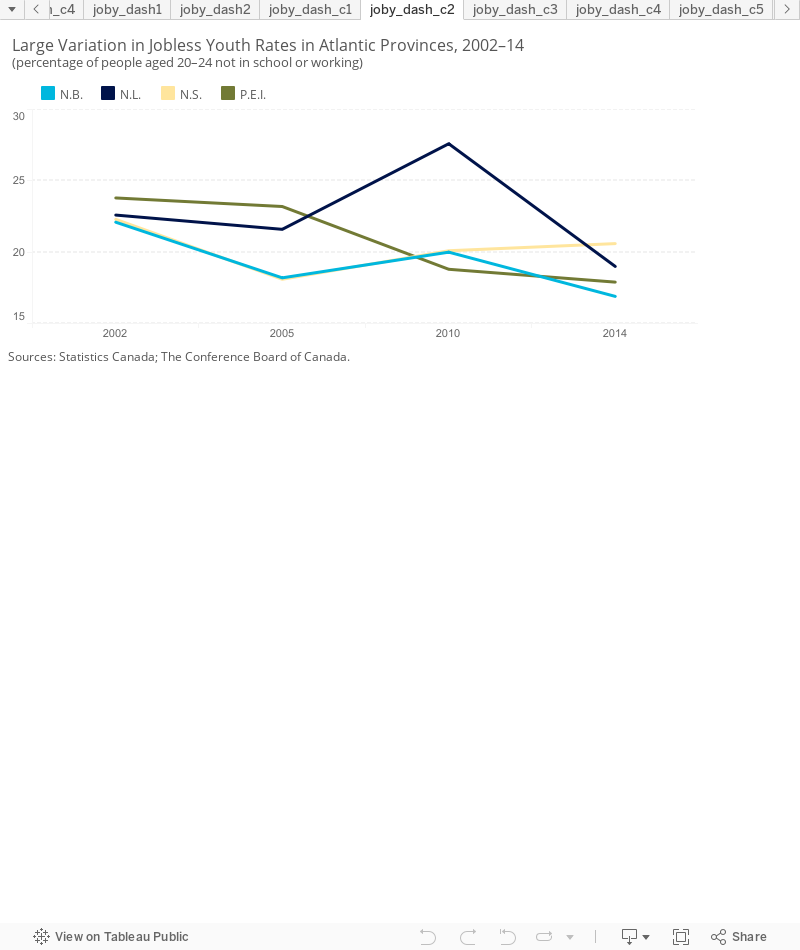
Notably, the Atlantic provinces experienced large variations in youth joblessness between 2002 and 2014.
Following the 2008–09 recession, youth unemployment increased in most provinces and territories. Between 2005 and 2010, Manitoba, Saskatchewan, New Brunswick, and Nova Scotia saw slight increases, ranging from 0.4 to 2 percentage points, while Ontario, Yukon, Newfoundland and Labrador, and Nunavut had relatively large increases, ranging from 3.6 to 7.2 percentage points. (Data for Yukon should be viewed with caution because of high sampling variability.)
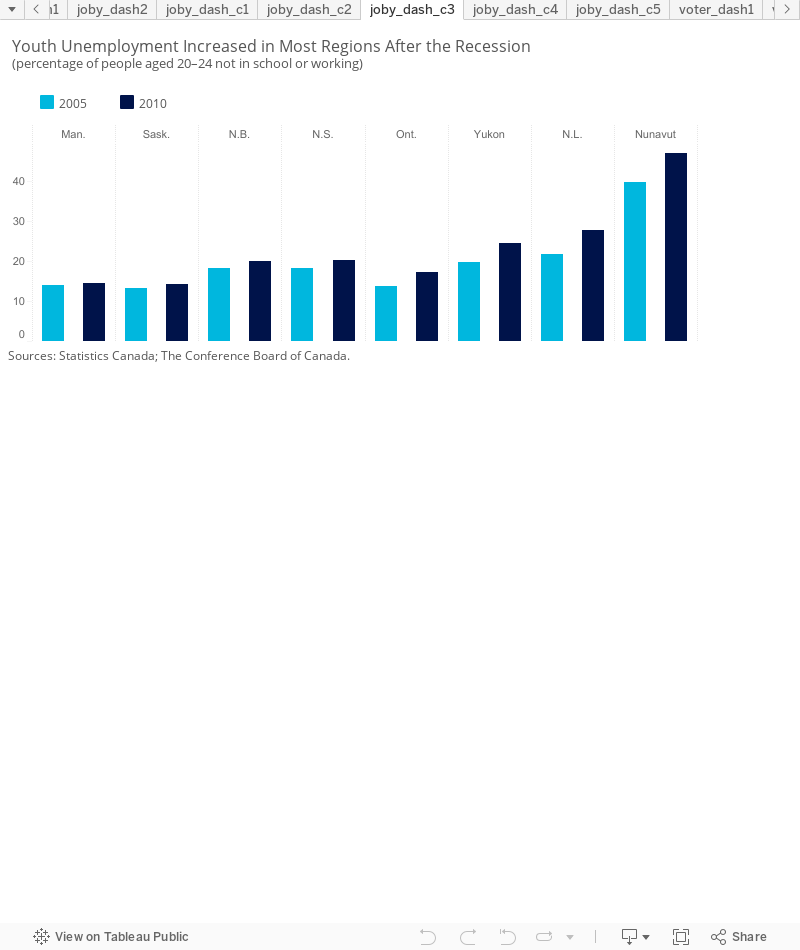
The increase in youth unemployment across most Canadian provinces and territories was mirrored in many other countries. Notably, across OECD countries, 40 million young people aged 15–29 remain not in employment, education, or training eight years after the recession; of these, nearly 28 million young people are inactive—not looking for work.5
What percentage of jobless youth are not in the labour force?
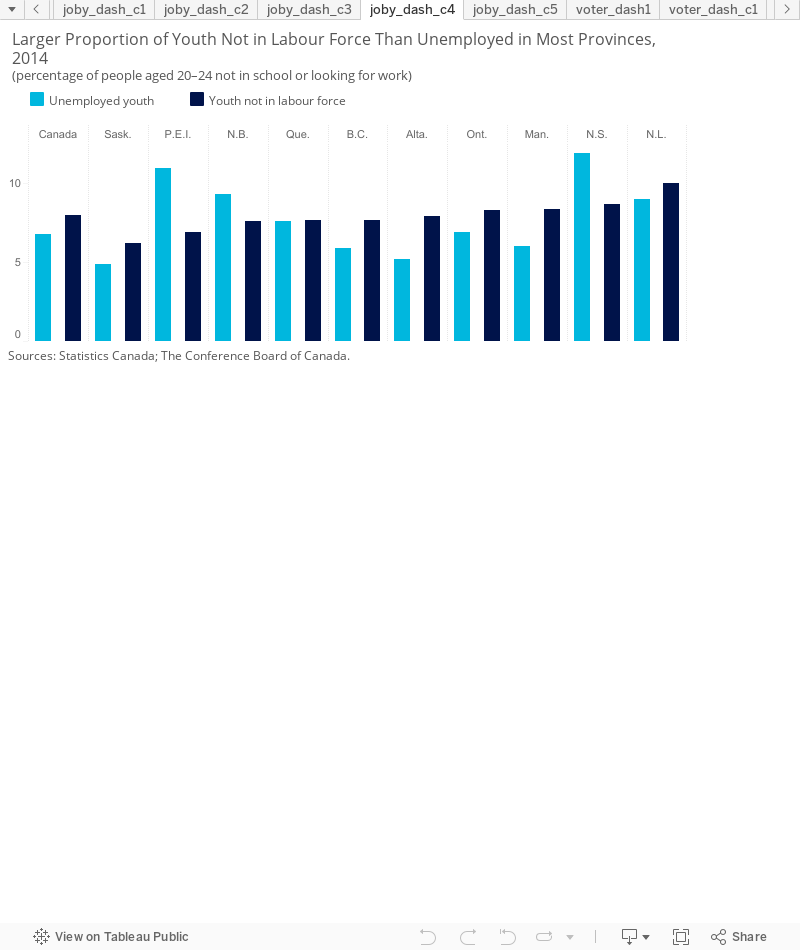
Of the 14.8 per cent of Canadians aged 20–24 who are neither in school nor working, over half are not in the labour force—that is, not looking for a job.
In Nova Scotia, P.E.I., and New Brunswick, the percentage of individuals not in school who are unemployed is larger than the percentage of those who are not looking for a job.
For the majority of provinces, however, the percentage of individuals aged 20–24 not in school who are not looking for a job is larger than the percentage of those who are unemployed.
Notably, even though the population of jobless youth tends to be equally divided between men and women in Canada,6 more women than men are not in school nor in the labour force across all provinces.7
In 2014, 9.4 per cent of men and 15.3 per cent of women aged 20–24 who were not in school were also not in the labour force.8 The gap was particularly pronounced in Manitoba and Alberta, where the percentage of women not in school and not in the labour force was over three times higher than that of men. Estimates for 20169 show that 10.3 per cent of men and 14.6 per cent of women aged 20–24 who were not in school were also not in the labour force.
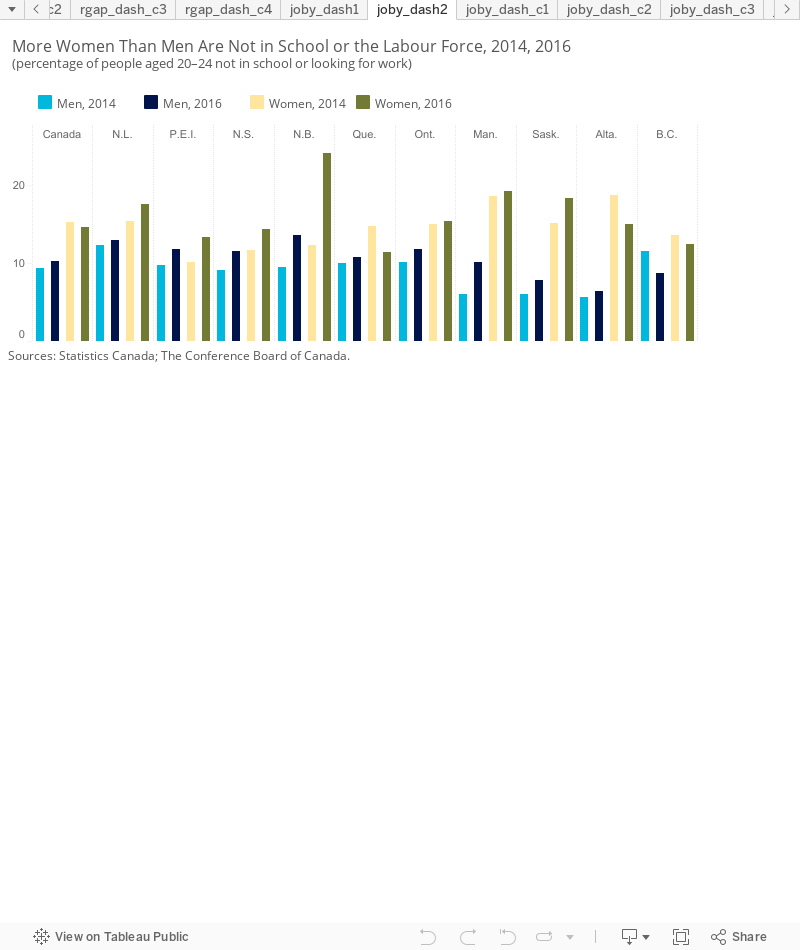
This gap between men and women is often because of childcare responsibilities: some women “prefer caring for children at home while they are young … others, however, have no choice because they cannot access or afford childcare for their small children.”10 This explains why the gap increases for those aged 25–29, who are more likely to have children.11
How do the jobless rates compare for 25 to 29 year olds in Canada?
Although our analysis focuses on the jobless rate for young adults ages 20–24, individuals are increasingly staying in school and delaying the transition to work for longer.12 Therefore, it is worthwhile examining how many individuals belonging to a slightly older age cohort (25 to 29 year olds) are neither employed nor in education, in order to provide a more complete picture of the jobless youth rate in Canada.
In 2014, 17.7 per cent of Canadians aged 25–29 were jobless. This rate is slightly below the OECD average of 20.5 per cent.13
Across the provinces, the percentage of individuals aged 25–29 not in school or working ranged from a low of 12.4 per cent in Saskatchewan to a high of 21.8 per cent in New Brunswick.
In Saskatchewan, Manitoba, Alberta, Ontario, B.C., Quebec, New Brunswick, and Canada overall, joblessness among 25 to 29 year olds was the same as or higher than the jobless rate of 20 to 24 year olds.
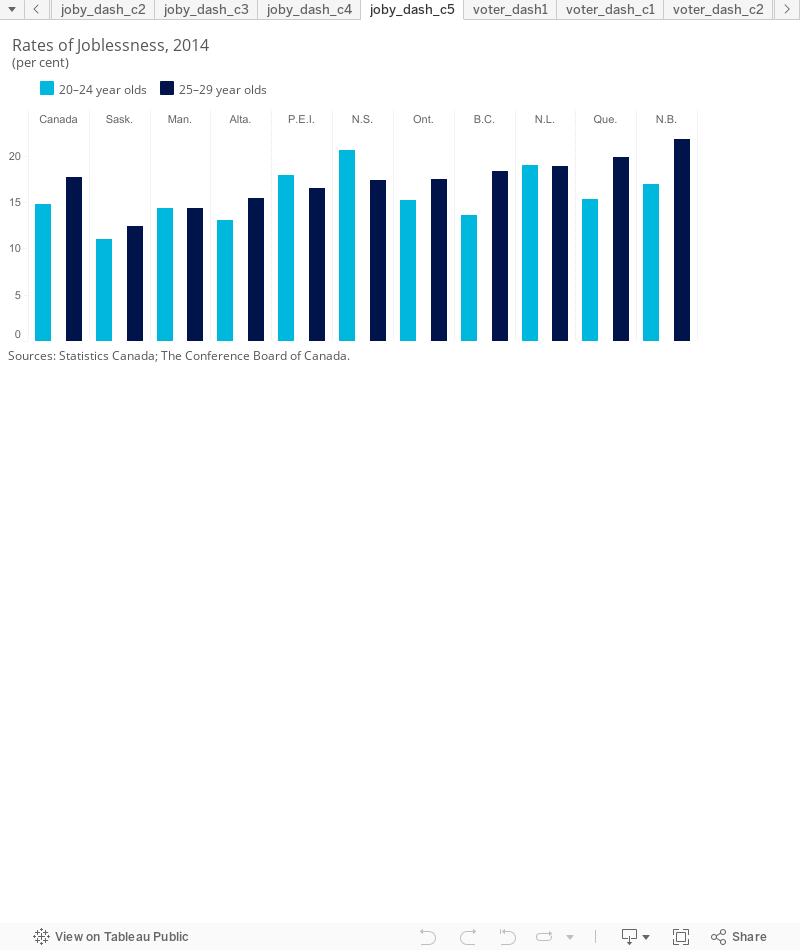
Notably, the three Prairie provinces—Saskatchewan, Manitoba, and Alberta—had the lowest jobless rates for 25 to 29 year olds, just as they did for those aged 20–24.
What can Canada and the provinces and territories do to improve youth employment?
On average, about 15 per cent of Canadians aged 20–24 are neither in school nor working. While unemployment is often an expected stage of transition between finishing school and finding a job,14 long-term youth unemployment poses challenges to individuals, communities, and societies.
Young adults who are not pursuing education or working can benefit from targeted policy interventions like specialized training opportunities and “mentoring, as well as a coordinated package of services that allow them to surmount barriers to employment, including health problems, skills deficits and social isolation.”15 Such services can include English and French language training, skills assessment, job search training, employment coaching, and apprenticeship programs.
The OECD identified a series of interventions to promote self-sufficiency among young people:
- Fight early school leaving to help “ensure that all young people obtain at least an upper-secondary degree that entitles them to pursue further studies or gives them the vocational skills to succeed in the labour market.”16
- Provide quality vocational education and training (e.g., co-op placements, internships, apprenticeships) to help young people develop necessary work skills and experiences.
- Offer career guidance to help young people choose a career path best suited to their skills and interests.
- Implement “youth guarantees,” that is, large-scale policies that aim for “in-depth structural reforms of training, job-search and education systems to drastically improve the transition from school to work and the employability of young people.”17 These initiatives, which have been implemented widely throughout the European Union, have helped ensure that young people are re-engaged in employment, education, or training within four months of becoming unemployed or leaving formal education.
Efforts to reduce the rate of jobless youth in Canada now under way include, at the federal level, initiatives like the Youth Employment Strategy, which offers programming to help young people build or improve their skills and work experiences to be able to successfully transition to the labour market.18
At the provincial level, Quebec’s Youth Policy 2030, released in March 2016, outlines five areas for intervention, including targeting academic success (e.g., reducing the number of school drop-outs) and employment readiness (e.g., improving vocational and technical training opportunities) for young people.19
Ontario’s Youth Jobs Strategy provides intensive employment support to young people who experience multiple barriers to employment, funding for programs that bridge the gap between post-secondary training programs and skills that businesses need, and support for university- and college-based entrepreneurship programs, among other initiatives.20
To be sure, the interventions outlined above require coordinated efforts between governments and non-governmental actors to reach disaffected and jobless young adults. In particular, collaboration between educational institutions and public employment services can support targeted outreach strategies that strengthen young people’s work skills and experiences, thereby reducing some of the potential barriers to unemployment.
Footnotes
1 OECD, Society at a Glance 2016.
2 Katherine Marshall, Youth Neither Enrolled Nor Employed (Ottawa: Statistics Canada, May 23, 2012).
3 The coefficient of variation for this statistic is greater than 16.5 per cent and less than or equal to 33.3 per cent.
4 Calculations based on Statistics Canada CANSIM 051-0001, International Migrants, by Age Group and Sex, Canada, Provinces, and Territories (accessed November 4, 2016).
5 OECD, Society at a Glance 2016.
6 Katherine Marshall, Youth Neither Enrolled Nor Employed (Ottawa: Statistics Canada, May 23, 2012); OECD, Society at a Glance 2016.
7 Statistics Canada, CANSIM Table 282-0005, Labour Force Survey Estimates (LFS), by Full- and Part-Time Students During School Months, Sex and Age Group, Unadjusted for Seasonality (accessed November 4, 2016).
8 Ibid.
9 At the time of writing, data were available for January to April and September to October, inclusively.
10 OECD, Society at a Glance 2016, 27.
11 Ibid.
12 Statistics Canada, CANSIM Table 477-0062, National Graduates Survey, Postsecondary Graduates by Province of Study and Level of Study (accessed November 4,2016).
13 Statistics Canada, Education Indicators in Canada.
14 Katherine Marshall, Youth Neither Enrolled Nor Employed (Ottawa: Statistics Canada, May 23, 2012).
15 OECD, Employment Outlook 2016, 2.
16 OECD, Society at a Glance 2016, 44.
17 European Commission, EU Youth Guarantee: Questions and Answers, news release, February 4, 2015.
18 Government of Canada, Youth Employment Strategy.
19 Gouvernement du Québec, Politique Québécoise de la Jeunesse 2030.
20 Ontario Ministry of Finance, Developing a Highly Skilled Workforce, backgrounder, April 23, 2015.