
Acceptance of Diversity
Key Messages
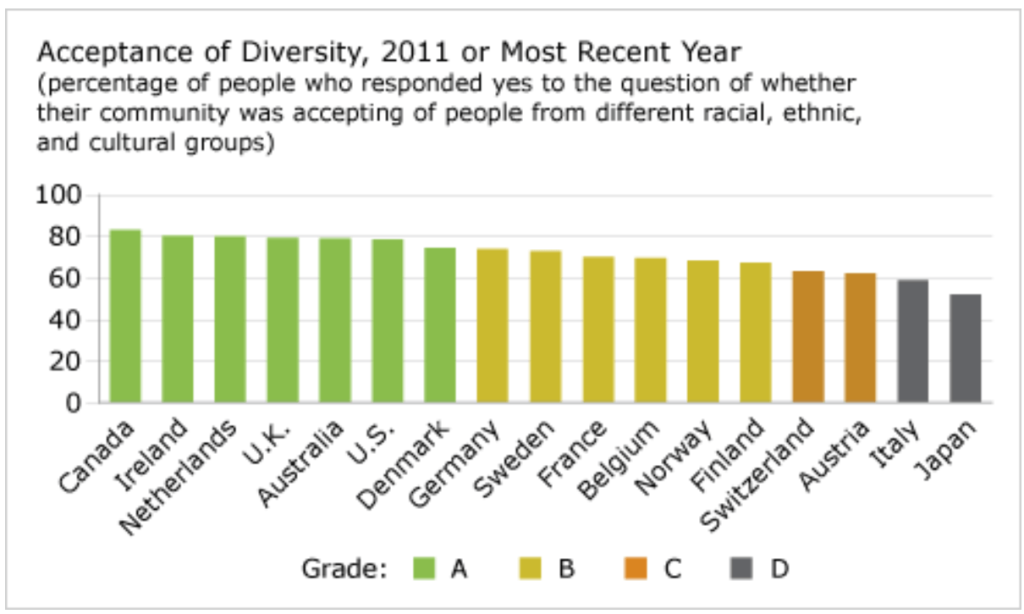
- Canada is the best performer on this indicator.
- Only 52 per cent of Japanese polled said their community was accepting of people from different racial, ethnic, and cultural groups.
- Canada’s visible minority population will grow faster than the rest of the population.
Putting acceptance of diversity in context
Canada is one of the most multicultural countries in the world, but how deeply do Canadians embrace this diversity? What is the level of acceptance and inclusion among groups? And how do other countries fare in comparison? There are many facets to diversity—including race, religion, culture, language, and sexuality. But this indicator focuses on how citizens in Canada and peer countries accept racial, ethnic, and cultural diversity.
How is acceptance of diversity measured?
There are few well-established programs of official reporting on subjective well-being in OECD countries. The Conference Board used the World Values Survey data on acceptance of diversity in previous How Canada Performs report cards. Unfortunately, the most recent data for Canada from the survey is from 2006. Consequently, the data for this year’s How Canada Performs acceptance of diversity indicator are drawn from the Gallup World Poll of 2011. The indicator measures the percentage of people who respond “yes” to the question of whether their community was accepting of people from different racial, ethnic, and cultural groups.
The World Values Survey is currently carrying out a new wave of surveys, the results of which will be used in How Canada Performs report cards.
How racially diverse is Canada?
Data from the latest Canadian census reveal that an estimated 5.3 million Canadians belong to a visible minority, accounting for 16.2 per cent of Canada’s total population. This is up from 13.4 per cent in 2001 and 11.2 per cent in 1996.1 Between 2001 and 2006, Canada’s visible minority population increased by 27 per cent, five times faster than the growth rate of the overall population.2
Acceptance of diversity in Canada is critical, not only on moral grounds but also to make the most of the skills and qualifications of the country’s diverse population.
Which countries are the least accepting of diversity?
Japan and Italy are the worst performers on this indicator—they earn “D” grades. Only 52 per cent of Japanese and 59 per cent of Italians said their community was accepting of people from different racial, ethnic, and cultural groups.
How does diversity contribute to the Canadian economy?
Canada’s future prosperity depends on its people, including an increasing number of visible minorities. Canada’s visible minority population is projected to increase much faster than the rest of the population. According to demographic projections by Statistics Canada, the ethnocultural diversity of Canada’s population will increase greatly by 2031. In the Canada Year Book 2011, Statistics Canada reports: “By 2031, 29% to 32% per cent of Canada’s population—between 11.4 and 14.4 million people—could belong to a visible minority group, which is nearly double the proportion (16%) and more than double the number (5.3 million) reported in 2006.”3
At a time when Canada is already facing severe labour shortages in certain provinces, and given the forecast for shrinking labour availability as the baby boomers begin to retire in significant numbers, it is clear that immigrants will make up an increasing share of Canada’s labour force.
A 2004 study by the Conference Board concluded that visible minorities accounted for over 0.3 per cent per year of growth of potential output and, in turn, of real gross domestic product between 1992 and 2001. In the years ahead, their contribution promises to be at least as important as it already has been. As strong as the contribution of visible minorities is, it could be even stronger if not for the 14.5 per cent wage gap that exists. This gap is persistent and deepening. Evidence suggests that a learning recognition gap—due to widespread failure in Canada to recognize foreign credentials or foreign work experience—explains a portion of the wage gap. Full elimination of this wage gap would benefit not only visible minorities but also the overall Canadian economy.
Interested in reading more about the contribution of visible minorities to the Canadian economy?
Making a Visible Difference: The Contribution of Visible Minorities to Canadian Economic Growth, Ottawa: The Conference Board of Canada, 2004.
The noted author Richard Florida argues that the key to economic growth lies in the ability of a city, region, or country to attract a “creative class” of people and to translate that underlying advantage into creative economic outcomes in the form of new ideas, new high-tech businesses, and regional growth. One important factor in attracting the creative class is diversity—that is, an area’s openness to different kinds of people and ideas.
Find out how Canadian cities rank on diversity:
City Magnets II: Benchmarking the Attractiveness of Canada’s CMAs, Ottawa: The Conference Board of Canada, 2010.
Are Canadian organizations committed to diversity?
In 2006, the Conference Board conducted a survey of diversity-related practices and priorities in Canadian private and public sector organizations. The survey looked at the extent to which diversity has become an integral component of the strategic planning and operational functioning of Canadian organizations.
Canadian organizations that participated in the survey stated a strong commitment to diversity, but their performance on diversity-related measures (such as representation rates, integrated strategic plans, and diversity-related investments, activities and initiatives) is mediocre. There is a gap between policy and performance, with many organizations failing to follow through on their stated commitment to diversity with initiatives and practices that foster and sustain diverse and inclusive work environments.
Learn more about diversity in Canadian organizations:
The Power of Diversity, Ottawa: The Conference Board of Canada, 2012.
Working in Multicultural Teams: How to Leverage Diversity, Ottawa: The Conference Board of Canada, 2011.
Workplace Diversity and Inclusiveness Forum: Translating Diversity into Business Advantage. Ottawa: The Conference Board of Canada, 2011.
Footnotes
1 Statistics Canada, Canada’s Ethnocultural Mosaic, 2006 Census: Highlights (accessed August 31, 2009).
2 Statistics Canada, Canada’s Ethnocultural Mosaic, 2006 Census: Highlights (accessed August 31, 2009).
3 Statistics Canada, Canada Year Book 2011, 2011, 180.