
Intergenerational Income Mobility
Key Messages
- Most provinces do well on international income mobility, with eight scoring “A” grades.
- Saskatchewan ranks below the national average and gets a “B.”
- Manitoba has the lowest income mobility among all Canadian jurisdictions.
Putting intergenerational income mobility in context
Intergenerational income mobility refers to the extent to which income levels are able to change across generations. If there were no intergenerational income mobility, all poor children would become poor adults, and all rich children would become rich adults.
Similarly, if there were complete income mobility between generations, there would be no relationship between family background and the adult income outcomes of children. A child born into poverty would have exactly the same likelihood of earning a high income as a child born into a rich family.
While income inequality can be thought of as an indicator of equality of outcome, intergenerational income mobility can be thought of as an indicator of equality of opportunity. The two indicators are closely related: “Inequality reduces mobility because it shapes opportunity,” writes Miles Corak, a professor of economics at the University of Ottawa and leading researcher on intergenerational income mobility.1 “Anything that boosts inequality reduces mobility because it differentially changes both opportunities and incentives for families to invest in their children.”2
How is intergenerational income mobility measured?
Intergenerational income mobility is measured by calculating the elasticity of intergenerational earnings. A higher elasticity number implies that it is more difficult for a person to move outside the income bracket that he or she was born into.
For example, if a region has an intergenerational elasticity of 0.50, then about 50 per cent of the earnings differences among the parents’ generations will be passed on to their children. So, for example, if a father’s income was $10,000 higher than the average, then his child would earn $5,000 more than the average in his or her age cohort.
International and provincial data are not comparable, so we compute rankings only at the provincial level for this report card. The earnings elasticity data for Canada and the provinces and territories were computed using data for both sons and daughters, as opposed to using data only on sons’ earnings relative to the earnings of their fathers, as is done for international data. Furthermore, family income, the income of an individual and his or her partner as reported on T1 tax returns, was used to arrive at the elasticity figures. This is the case for both parents and children. Income includes market income (total income before tax minus income from government sources) and transfer income (such as social assistance, unemployment insurance, old age security, and child benefits).
The income elasticity associated with a given region was calculated based on the place of residence as indicated on the parents’ T1 form when the children were 15 to 19 years old. So, income mobility for a given province or territory also reflects geographical mobility, since the incomes of the children in adulthood may have been earned in other provinces or territories.
How do the provinces do relative to one another on income mobility?
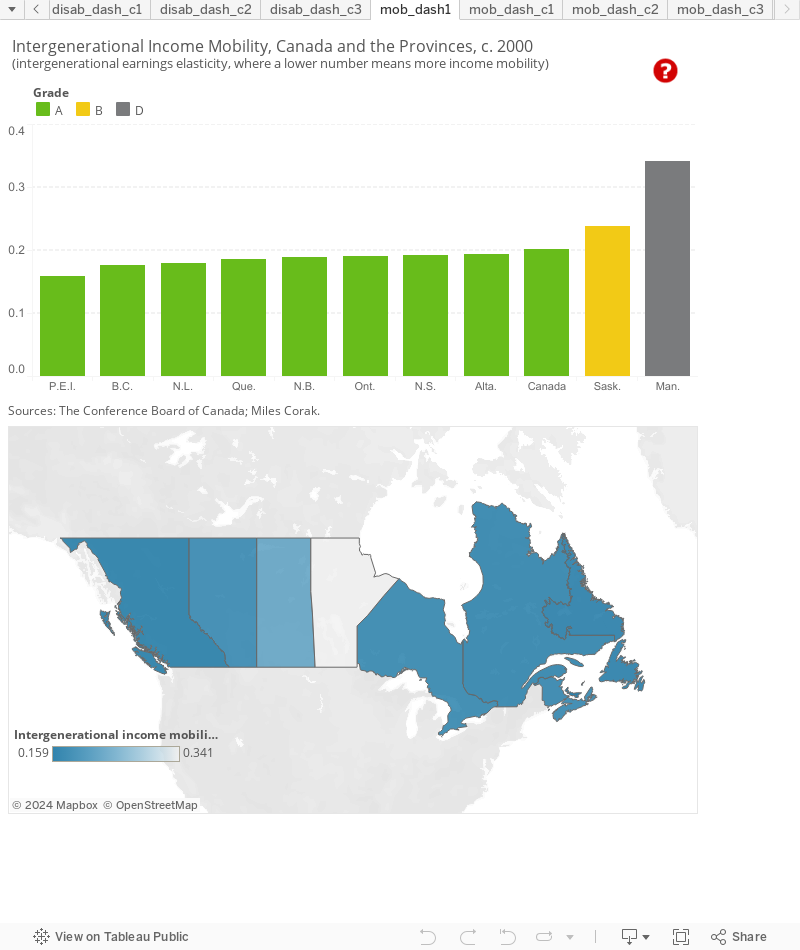
Almost all the provinces fare well on intergenerational income mobility, with eight scoring “A” grades. P.E.I. has the highest income mobility among the provinces, with an intergenerational earnings elasticity of 0.159. So, a child in P.E.I. whose parent earns $10,000 less than the average income will later earn $1,590 less than average. In other words, only 16 per cent of the difference in parental earnings is passed down to their children.
The other “A” provinces have earnings elasticities in the 0.18 to 0.19 range: B.C. (0.176), Newfoundland and Labrador (0.180), Quebec (0.186), New Brunswick (0.189), Ontario (0.191), Nova Scotia (0.192), and Alberta (0.194).
Saskatchewan gets a “B” and ranks below the national average of 0.201 with an earnings elasticity of 0.238.
Manitoba has the lowest intergenerational income mobility among the provinces with an earnings elasticity of 0.341. In the province, if a family earns $10,000 less than the average, the children will likely earn $3,400 less than the average—in other words, 34 per cent of the earnings disadvantage is passed on to the children. Manitoba’s income mobility is less than half that of top-ranked P.E.I.
How do the territories fare on intergenerational income mobility?
Data are not available separately for the Northwest Territories and Nunavut; together, however, these territories have an intergenerational earnings elasticity of 0.175, which places them among the “A” provinces.
Yukon’s income mobility is slightly lower—the territory has an earnings elasticity of 0.187, which also makes it an “A” performer.
The territories are not included in the overall benchmarking rankings because data for the territories are not available for key indicators included in the society report card. However, the Conference Board is committed to including the territories in our analysis, and so we provide information on territorial performance when data are available.
How does Canada do relative to its peer countries on income mobility?
Although comparable data are not available to benchmark the provinces relative to Canada’s peer countries, it is possible to examine how Canada fares overall in a global context.3 The earnings elasticity data used for the peer country benchmarking are derived from father-son income data. Typically, earnings elasticity is calculated using data on fathers’ incomes and those of their sons, because this is the least complicated relationship with respect to income and labour participation and because more reliable and comparable data are available for making international comparisons.4
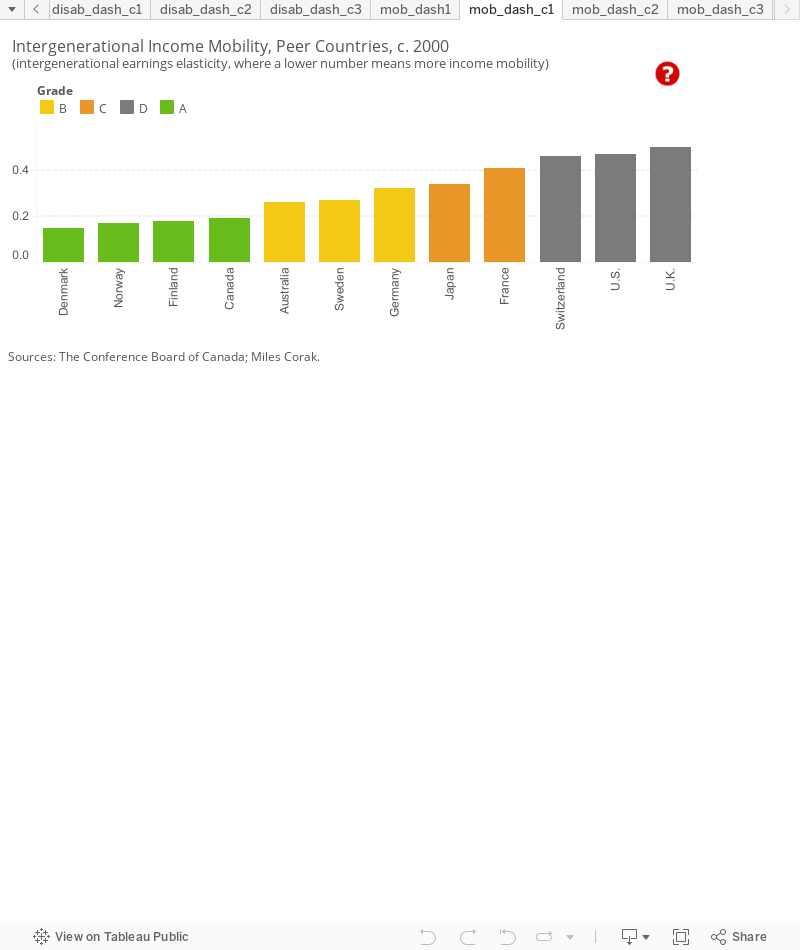
Overall, Canada has an earnings elasticity of 0.19, ranks 4th among 12 peer countries (data are not available for Austria, Belgium, Ireland, and the Netherlands), and is an “A” performer, ranking behind Denmark (0.15), Norway (0.17), and Finland (0.18). In top-ranking Denmark, a child whose parent earns $10,000 less than the average income will earn $1,500 less than average. So, only 15 per cent of the difference in parental earnings is passed down to children.
Switzerland (0.46), the U.S. (0.47), and the U.K. (0.5) are the worst-ranked peer countries, with all three getting “D” grades. The U.K. has an earnings elasticity of 0.5. Parents earning $10,000 less than the average will pass on 50 per cent of that difference to their children. The children, in other words, will earn $5,000 less than the average.
Does it matter when in the life cycle income mobility is calculated?
Yes. Ideally, we want to compare the permanent, lifetime earnings of parents and their adult children—in other words, the earnings when individuals are established in their careers. This is not easy, as data spanning several years need to be available for both parent and child over a period during which they are at least mid-career. So, life-cycle bias may affect estimates of intergenerational income mobility. In other words, if children’s earnings are observed too early in their careers, income mobility can be overstated.
For example, children in their late 20s or early 30s are not yet established in their careers, and those with a high level of educational attainment may just be starting their careers. Using data from these cohorts to compute income mobility would give the impression that the children’s earnings are weakly linked to those of their parents.5
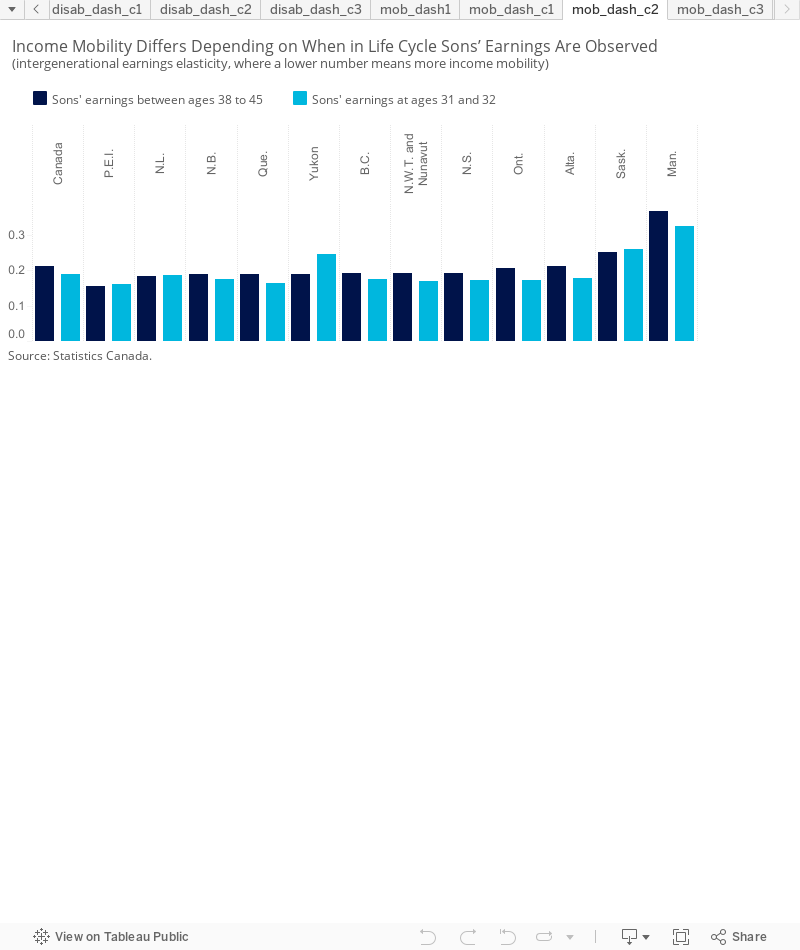
Earnings elasticity figures for Canada and the provinces and territories using data for sons in their early 30s (31 and 32 years old) and later in their careers (38 to 45 years old) are available for comparison.6 Canada’s intergenerational earnings elasticity is 13 per cent higher (income mobility is lower) using the older cohort data, at 0.21 compared with 0.19 using the younger cohort data. For most provinces, earnings elasticity is higher using data on sons’ earnings for older cohorts, ranging from an increase of 20 per cent in Ontario (0.171 to 0.206) to a 9 per cent increase in B.C. (0.175 to 0.191).
Interestingly, for P.E.I., Newfoundland and Labrador, and Saskatchewan, earnings elasticity is lower using data for the older age cohort. The figures for Yukon are even more puzzling, with the earnings elasticity dropping 23 per cent (0.246 to 0.190).
Is intergenerational income mobility different for daughters?
Daughters’ incomes depend less on the incomes of their fathers in Canada, according to a Statistics Canada study. Earnings elasticity is 0.25 using father-daughter income data but much higher (income mobility is lower), at 0.36, using father-son total income data.7
What’s more, income mobility estimates for daughters do not seem to be affected by the life-cycle bias—income mobility estimates based on daughters’ earnings at age 30 are not very different from those based on earnings at age 40.
A few factors may be behind the lower father-daughter earnings elasticity and the fact that the figures are not affected by the age at which daughters’ incomes are observed:
- Because women, typically, are more likely than men to take parental leave, career breaks affect career advancement and, hence, earnings.
- Women with high earnings potential are more likely to marry high-earning husbands (“assortative mating”) and, thus, may choose to work fewer hours or accept lower-paying jobs to achieve better work-life balance. So, the fathers’ earnings are more closely linked to the daughter’s family income (daughter and her husband) than to the daughters’ earnings.8
- The gender wage gap may also play a role in the weaker relationship between fathers’ and daughter’s earnings. The daughter of a high-income father may be less likely to earn a similarly high income because of the gap in wages and career advancement opportunities between men and women.
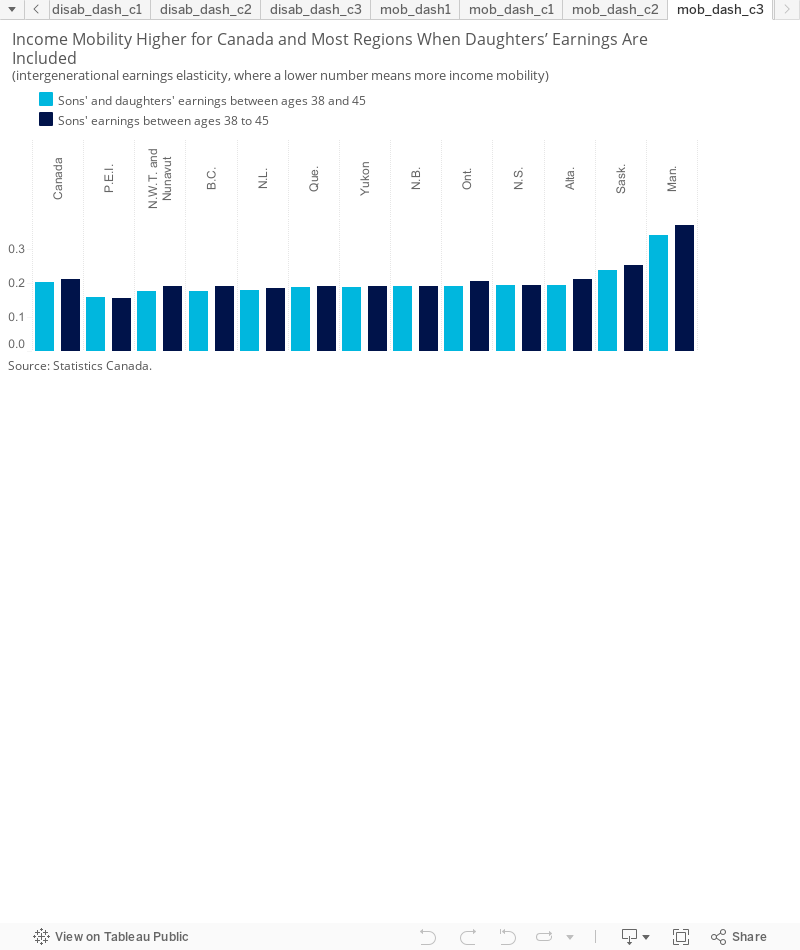
For almost all the provinces and territories, intergenerational income mobility is higher when both daughters’ and sons’ incomes are used than when only father-son data are used, according to earnings elasticity data computed by Miles Corak using data on sons’ incomes and those of both sons and daughters between the ages of 38 and 45.9 The only exceptions are P.E.I., where the income elasticity is higher when both sons’ and daughters’ earnings are included in the calculations, and Nova Scotia, where the income elasticity remains the same. Note that Corak computed the earnings elasticity data for Canada using family income data—i.e., the income of the individual and his or her partner—which may explain much of the difference in the national figures relative to those computed by Statistics Canada.
Data also reveal that the likelihood of falling into an intergenerational cycle of low income is higher for boys than it is for girls in Canada. In other words, girls from low-income families are less likely to remain in the bottom of the income distribution than boys with similar backgrounds.10
What affects intergenerational income mobility?
Income inequality and intergenerational income mobility are linked. As noted by the OECD, “the more unequal a society is, the more difficult it is to move up the social ladder, simply because children have a greater gap to make up.”11 Countries like Denmark, Norway, and Finland that have high income mobility also have low income inequality. And countries with high income inequality, like the U.S. and the U.K., have low income mobility.
But there are exceptions. Canada and Australia have relatively high levels of income inequality, ranking 13th and 15th, respectively, among 16 peer countries on the latest indicator report card. Yet both countries have relatively high income mobility. So, while income inequality is related to intergenerational income mobility, it is not the determining factor—there are a number of factors that influence the persistence of poverty and the transmission of wealth.
Factors that have a large and significant effect on intergenerational income mobility include:
- Education: The level of a child’s education has a significant effect on the persistence of income across generations, but so does that of his or her parents. In fact, parental education is one of the most critical determinants, as educational attainment tends to persist across generations.12
- Wealth: Parental wealth can affect children’s income directly, through gifts and inheritance, and indirectly, by providing good housing and access to better nutrition, health care, and education.13 Socio-economic status may also provide social connections that help with access to schools and job opportunities.
- Social conditions: Unemployment rates in a child’s local environment affect income mobility. “Growing up in a ‘good’ neighborhood with low unemployment is associated with higher earnings when the child reaches adulthood.”14
- Genetically inherited traits: While inherited cognitive abilities such as IQ have a small effect on intergenerational income mobility, inherited non-cognitive abilities can have a major impact. Personality traits (which are inherited but also learned) such as locus of control (the extent to which people believe they are in control of outcomes in their lives) and self-esteem have a large effect on income mobility.15
Given that household wealth and parental education are key factors in determining a child’s future opportunities, reducing childhood poverty may be one way to improve intergenerational income mobility. Growing up in a low-income household is often associated with poorer nutrition and housing, which affect health outcomes, which, in turn, affect childhood development and education and, as a result, future incomes. Ensuring that disadvantaged children have access to good-quality health care and early childhood education programs may be another way to break the low-income cycle and promote income mobility.
Footnotes
1 Miles Corak, Income Inequality, Equality of Opportunity, and Intergenerational Mobility, Discussion Paper No. 7520 (Bonn: Institute for the Study of Labor, 2013), 21 (accessed December 7, 2016).
2 Ibid., 13 (accessed December 7, 2016).
3 The source of the data used for international comparisons is Miles Corak’s Inequality From Generation to Generation: The United States in Comparison (accessed November 5, 2012).
4 Miles Corak, Inequality From Generation to Generation: The United States in Comparison, Discussion Paper No. 9929 (Bonn: Institute for the Study of Labor, 2016), 2 (accessed December 7, 2016).
5 Jo Blanden, “Intergenerational Income Persistence: Measures of Intergenerational Persistence Can Be Indicative of Equality of Opportunity, but the Relationship Is Not Clear Cut,” IZA World of Labor, August 2015 (accessed November 30, 2016).
6 Miles Corak, Divided Landscapes of Economic Opportunity: The Canadian Geography of Intergenerational Income Mobility (Ottawa: University of Ottawa, forthcoming).
7 Wen-Hao Chen, Yuri Ostrovsky, and Patrizio Piraino, Intergenerational Income Mobility: New Evidence From Canada (Ottawa: Statistics Canada, June 2016), (accessed December 7, 2016), 21.
8 Ibid.
9 Miles Corak, Divided Landscapes of Economic Opportunity: The Canadian Geography of Intergenerational Income Mobility (Ottawa: University of Ottawa, forthcoming).
10 Miles Corak, “‘Inequality Is the Root of Social Evil,’ or Maybe Not? Two Stories About Inequality and Public Policy,” Canadian Public Policy, December 2016.
11 OECD, Growing Unequal? Income Distribution and Poverty in OECD Countries (Paris: OECD, 2008), 204.
12 Ibid., 216.
13 Ibid., 207.
14 Ibid.
15 Ibid.