
Child Poverty
Key Messages
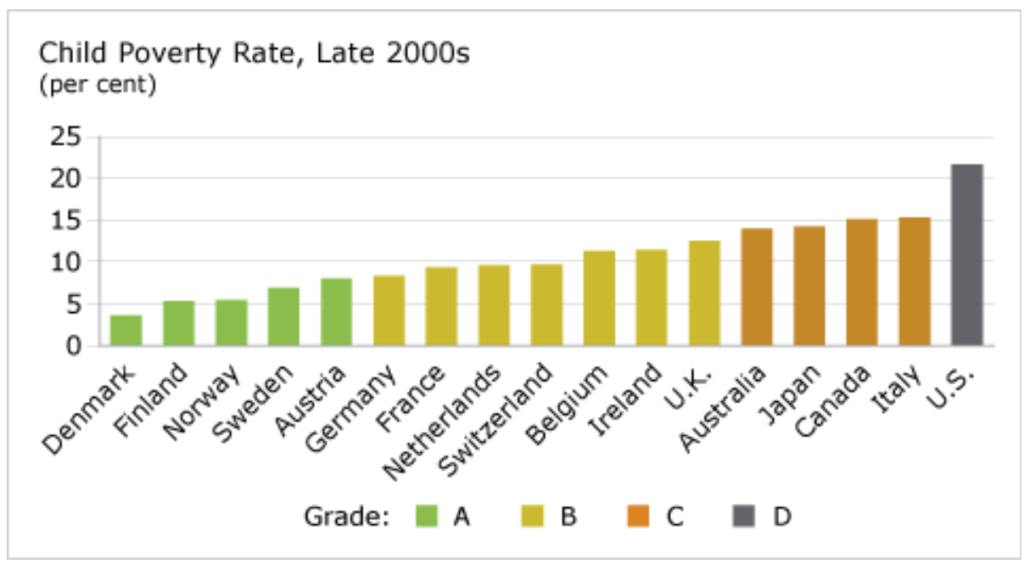
- Canada scores a “C” grade and ranks 15th out of 17 peer countries.
- More than one in seven Canadian children live in poverty.
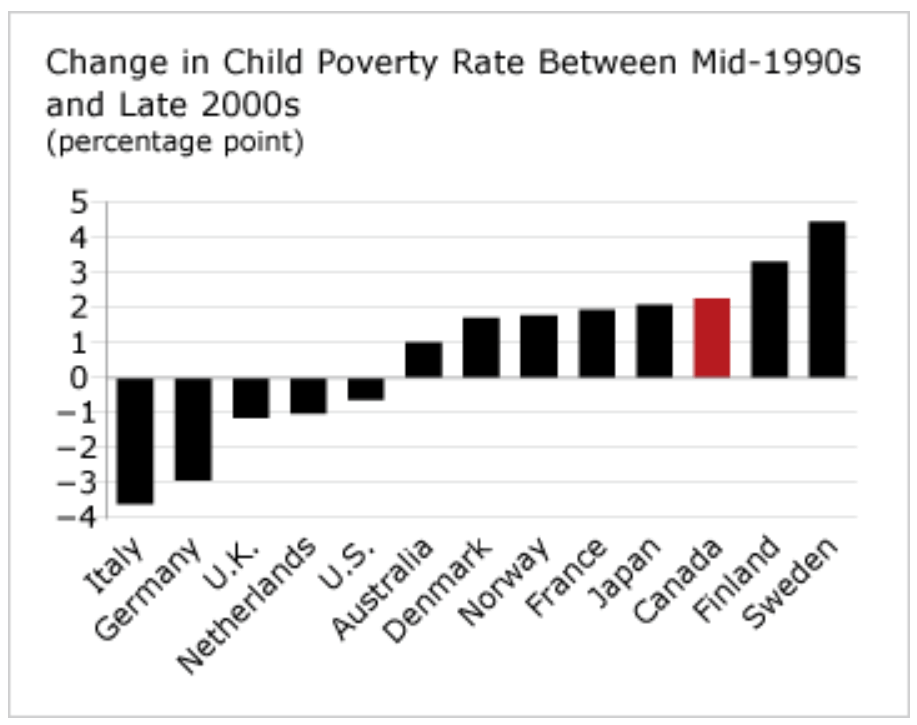
- Canada’s child poverty rate increased between the mid-1990s and the late 2000s.
Putting child poverty in context
Children who experience poverty, especially persistently, are at higher risk of suffering health problems, developmental delays, and behaviour disorders. They tend to attain lower levels of education1 and are more likely to live in poverty as adults.2
Moreover, the failure to address poverty may place a heavy burden on a country’s economy. As the OECD has concluded, “failure to tackle the poverty and exclusion facing millions of families and their children is not only socially reprehensible, but it will also weigh heavily on countries’ capacity to sustain economic growth in years to come.”3
The Conference Board of Canada uses the OECD’s relative measure of child poverty,4 which calculates the proportion of children living in households where disposable income is less than 50 per cent of the median in each country.
Is the child poverty rate declining in Canada?
Not according to the latest statistics from the Organisation for Economic Co-operation and Development (OECD). In 1989, the Canadian House of Commons unanimously resolved to eliminate child poverty by the year 2000, and there was some initial success; the child poverty rate fell from 15.8 per cent in the mid-1980s to 12.8 in the mid-1990s. Since then, however, the rate has increased—to 15.1 per cent in the late 2000s—reversing earlier progress.
Of the 13 countries for which historical data are available, Canada had the third-highest jump in the child poverty rate between the mid-1990s and the mid-2000s. Sweden had the largest increase—from 2.5 per cent to 7.0 per cent. Five countries—Italy, Germany, the U.K., Netherlands, and the U.S.—reduced their child poverty rates, although the U.S. still has the highest child poverty rate. Italy made the most progress.
In 1999, the U.K. set out on a 20-year mission to end child poverty through a series of integrated policies, including strengthening early learning, education, affordable housing, and health services, as well as raising the minimum wage and augmenting child benefits. The original target was to halve child poverty by 2010 and to end it by 2020. The country initially made great strides, reducing the child poverty rate from 16.2 per cent in 2000 to 10.1 per cent in the mid-2000s. Along with most countries, however, the poverty rate in the U.K. rose in the late 2000s as a result of the financial crisis. To meet the 2010 goal, the number of children living in low-income households needed to be reduced to 3.3 million. The number in 2009–10 was 3.8 million, meaning that the U.K. government was still 500,000 children above its target.5
How has Canada performed historically on this indicator?
Canada, like Australia, has received steady “C”s since the 1980s for its child poverty rate.
Four Nordic countries have been consistent “A” performers—Denmark, Finland, Norway, and Sweden. The U.S. has been the only consistent “D” performer.
Who are the role models on this indicator?
The Nordic countries have long been upheld as leaders in maintaining low rates of poverty. Their success lies in universal welfare policy that has been effectively combined with job creation strategies that support gender equality and accessibility.
What can Canada do to become a leader on child poverty?
There is a long-standing debate about the most effective means of reducing poverty. An OECD study on the effectiveness of child poverty strategies in OECD countries determined that the answer lies in striking the appropriate balance between a “benefits strategy” and a “work strategy.”6 The debate hinges on the apparent trade-off between ensuring adequate income assistance for families and providing incentives for people to work and provide for themselves.
On the surface, a benefits strategy appears to be most effective in reducing child poverty. Certainly, the relationship between social spending and poverty rates is striking. Denmark, Finland, Norway, and Sweden—four of the top performers on this indicator—all allot about 3 per cent or more of gross domestic product (GDP) for direct public spending on families, a full percentage point higher than the OECD average. And among the working-age population, relative poverty rates are lowest among OECD countries where social spending is the highest.
A clear link has been made, however, between joblessness and poverty. In Canada, relative poverty rates are highest among single parents and even more pronounced among non-working single parents. Across the OECD, non-employed families are the most economically disadvantaged, which means job creations strategies are an integral part of tackling poverty.
Countries that have reduced poverty rates have turned away from passive, benefits-only poverty reduction approaches in favour of national anti-poverty strategies that incorporate a number of “active” policies. Active policies are social policies that integrate strategies across governments, departments, and service providers to reduce poverty and increase self-sufficiency. For example, active job policies may be set up to help people overcome obstacles to get jobs through a combination of:
- funding jobs training
- providing child care
- introducing tax incentives for lower-paid workers
Are there other measures of child poverty?
Yes. Statistics Canada publishes poverty rates for Canada using a different measure of poverty than the OECD uses. Statistics Canada’s low income cut-off (LICO) is a threshold that defines the status of a family’s income. Families below the threshold spend a larger share of their income on necessities (that is, food, clothing, and shelter) than the average family does, leaving less money to spend on transportation, health, personal care, education, household operation, recreation, or insurance.
Statistics Canada reports that the proportion of Canadian children in poverty fell from a peak of 18.4 per cent in 1996 to 8.2 per cent in 2010.7 According to the LICO numbers, an estimated 550,000 Canadians under the age of 18 live in low-income households.8
Footnotes
1 Marc Frenette, Why Are Youth From Lower-Income Families Less Likely to Attend University? (Ottawa: Statistics Canada, 2007).
2 Dominique Fleury, “Low-Income Children,” Perspectives on Labour and Income 9, 5 (Ottawa, Statistics Canada, May 2008), 1 (accessed September 9, 2009).
3 OECD, Combating Poverty and Social Exclusion Through Work, Policy Brief (Paris: OECD, 2005).
4 Absolute poverty thresholds consider people to be living in poverty if their income is not enough to cover the costs of a given basket of goods in a particular year, updated annually for inflation. Relative poverty thresholds consider people to be living in poverty if their income cannot afford them the goods and services that are customary in a given society.
5 Hannah Aldridge, Anushree Parekh, Tom MacInnes, and Peter Kenway, Monitoring Poverty and Social Exclusion 2011 (York: Joseph Rowntree Foundation, 2011), 6 (accessed November 22, 2012).
6 Peter Whiteford and Willem Adema, What Works Best in Reducing Child Poverty: A Benefit or Work Strategy?OECD Social, Migration and Employment Working Paper No. 51 (Paris: OECD, March 2007), 36.
7 Statistics Canada, Income in Canada 2010 (accessed November 2, 2012).
8 Statistics Canada, Income in Canada 2010 (accessed November 2, 2012).
Society Indicators
See discussions on other indicators