
Life Satisfaction

Stay up to date
Looking for the latest research? Create a CBoC account and sign up for email updates.
Key Messages
- All provinces earn at least an “A” grade on life satisfaction, with 7 ranking in the top 10 among 24 comparator regions.
- Saskatchewan, Newfoundland and Labrador, P.E.I., and New Brunswick are top-ranked among all jurisdictions and earn “A+” grades.
- Overall, Canada earns an “A” and ranks 4th out of 16 peer countries.
Putting life satisfaction in context
Life satisfaction provides a measure of subjective well-being. Because it incorporates people’s own judgments about which features of their society are most important to them, there will be cases in which a population’s life satisfaction differs from what objective measures—such as the availability and impact of social and economic resources—suggest it should be. For instance, although high-income countries like Switzerland and Norway show high values of overall life satisfaction, these values are not “as high as a potential linear relationship between GDP and average life satisfaction would imply.”1
This is not to say that subjective measures of life satisfaction are meaningless. Rather, life satisfaction is a useful gauge of a society’s performance when considered together with other, objective measures, as it provides information on the perceived net impact of changes in social and economic conditions on individuals’ lives.2
Notably, life satisfaction has been shown to correlate with socio-demographic and economic factors such as age, income, education, employment, health, and supportive personal relationships.3 Thus, when measured, it provides a way of understanding overall well-being within society, which can help societies ensure that the social conditions for leading good lives are in place.
How is life satisfaction measured?
The OECD introduced a set of guidelines for measuring subjective well-being in 2013.4 These guidelines have helped to produce an official method for measuring and reporting on subjective well-being. For this report card, OECD data were used to determine international rankings, and Statistics Canada data were used for provincial and territorial rankings. The data from these sources are based on comparable measures—e.g., similar question construction, response format, and survey methodology.
The life satisfaction report card indicator is measured as the average score of responses given to the question “how do you feel about your life as a whole right now?” Responses to this question are given using a scale of 0 to 10, where 0 means “very dissatisfied” and 10 means “very satisfied.”5 The country, province, or territory score is the average value of individual responses in that region.
How do the provinces rank relative to international peers?
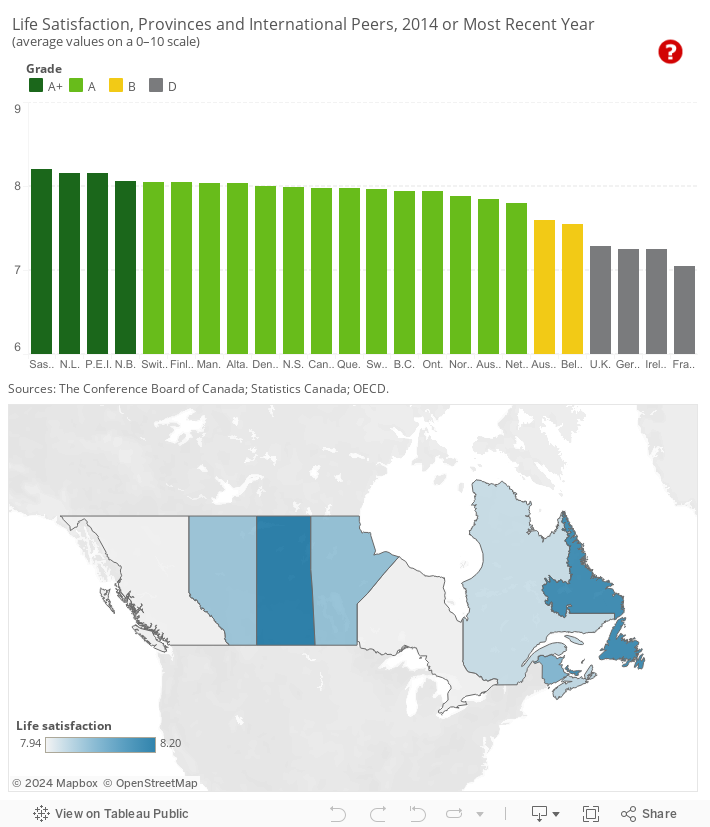
The provinces, and Canada overall, perform very well relative to international peers, showing some of the highest levels of life satisfaction among all peer jurisdictions. Four provinces outperform international peers on life satisfaction. Saskatchewan (8.2), Newfoundland and Labrador (8.16), P.E.I. (8.16), and New Brunswick (8.06) all receive “A+” grades for ranking above the top-ranked peer countries, Switzerland (8.05) and Finland (8.05).
The six remaining provinces earn “A” grades and outrank all but four of the peer countries examined. Manitoba (8.04) and Alberta (8.03) rank 7th and 8th, respectively, lagging only Switzerland and Finland. With an average life satisfaction score of 7.99, Nova Scotia ties Denmark in 9th spot, ranking just above the national average (7.98). Quebec’s life satisfaction score matches the national average. The province ranks 11th overall among the 24 comparator jurisdictions for which data are available. (A total of 24 peer provinces and countries are benchmarked on life satisfaction. Data are not available for Japan and the United States.)
Ontario and British Columbia tie for 14th place with scores of 7.94, just behind Sweden (7.96).
Overall, Canada ranks 4th among the 14 peer countries on life satisfaction. France is the lowest-ranked among all regions, with an average score of 7.04.
How do the provinces rank relative to each other?
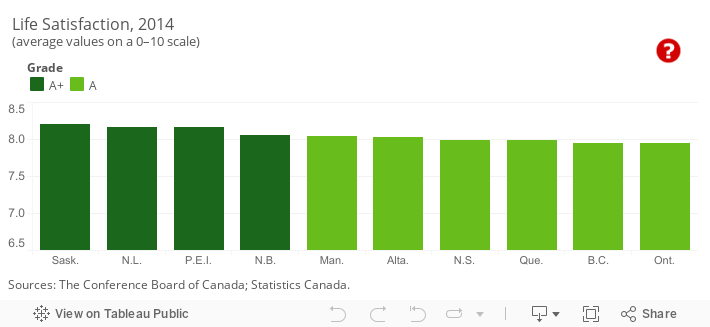
Variation in life satisfaction across the provinces is minimal, although seven provinces do score slightly higher than the Canadian average, while three match or are slightly below the Canadian average. Saskatchewan, which ranks highest among provinces and international jurisdictions, has an average life satisfaction score of 8.2. Newfoundland and Labrador and P.E.I. both have average life satisfaction scores of 8.16. New Brunswick’s, Manitoba’s, and Alberta’s average life satisfaction scores differ by only a small margin, at 8.06, 8.04, and 8.03, respectively.
Quebec’s average life satisfaction score is tied with Canada’s overall score. Ontario and British Columbia have the same average life satisfaction scores and are the lowest-ranked among the provinces.
The range between top-ranked Saskatchewan and the lowest-ranked provinces is just 0.26. Overall, people across Canada report relatively high levels of life satisfaction, with minimal variation between jurisdictions.
How do the territories rank relative to international peers?
Nunavut is the highest-ranked territory and outperforms all international peers with an average life satisfaction score of 8.15. This high score may be explained, in part, by Nunavut’s demographic composition. About 57 per cent of Nunavut’s population is below the age of 30.6 OECD analysis reveals that young people (aged 15–29) tend to report higher life satisfaction than individuals in the middle and older age brackets.7 Nonetheless, the results are surprising given the territory’s high suicide rate, high crime rates (particularly homicides, burglaries), and low ranking on other measures of social cohesion, such as voter turnout and jobless youth.
Yukon is an “A” performer with an average life satisfaction score of 7.88. The Northwest Territories’ score of 7.77 places it among the “B” performers, Australia (7.6) and Belgium (7.55). While the Northwest Territories is ranked lowest within Canada, it still outperforms six international peers: Australia, Belgium, the U.K. (7.28), Germany (7.25), Ireland (7.25), and France (7.04).
The territories are not included in the overall provincial and international benchmarking calculations because data for the territories are not available for key indicators included in the overall society report card. However, the Conference Board is committed to including the territories in our analysis, and so we provide information on territorial performance when data are available.
What contributes to higher life satisfaction?
Analysis conducted by the OECD reveals similar life satisfaction scores for men and women across countries, a correlation between higher levels of education and higher life satisfaction, and lower life satisfaction among those 50 years and older.8 Further, OECD data show that more than half of countries with high GDP per capita report high life satisfaction, while no countries with low GDP per capita report high life satisfaction.9
Findings from the World Happiness Report 2015 explain that six key variables account for three-quarters of the differences in countries’ life satisfaction scores:
- GDP per capita
- healthy years of life expectancy
- perceived social network support
- perceived absence of corruption in government and business
- perceived freedom to make life decisions (e.g., career choices, relationship choices, educational choices)
- generosity (as measured by recent donations)10
The first three of these factors account for the greatest share of variation in countries’ life satisfaction scores: differences in healthy years of life expectancy, GDP per capita, and perceived social network support.
Footnotes
1 Eurostat, Quality of Life in Europe.
2 OECD, OECD Guidelines on Measuring Subjective Well-Being.
3 Eurostat, Quality of Life in Europe.
4 OECD, OECD Guidelines on Measuring Subjective Well-Being.
5 Chaohui Lu, Grant Schellenberg, Feng Hou, and John F. Helliwell, “How’s Life in the City? Life Satisfaction Across Census Metropolitan Areas and Economic Regions in Canada,” Economic Insights, April 2015.
6 Calculations based on Statistics Canada CANSIM 051-0001, International Migrants, by Age Group and Sex, Canada, Provinces, and Territories (accessed August 12, 2016).
7 OECD, How’s Life? 2015—Measuring Well-Being.
8 Ibid., 101.
9 Ibid., 28–30.
10 John Helliwell, Richard Layard, and Jeffrey Sachs, World Happiness Report 2015, 21.