
Voter Turnout
Key Messages
- P.E.I. has the highest voter turnout among the provinces and scores a “B” grade.
- With a voter turnout rate of 61 per cent in the last federal election, Newfoundland and Labrador ranks at the bottom of the pack.
- Although voter turnout in Canada has decreased overall over the past 40 years, there was a notable increase in the 2015 federal election.
Putting voter turnout in context
Civic engagement through participation in the political system is one measure of social cohesion. Determining the underlying influences behind voter turnout rates can be difficult: a low turnout may be due to disillusionment or indifference, or even complacent satisfaction with the way the country is being governed. Conversely, a high turnout rate may reflect compulsory voting laws (as in Australia and Belgium) or coercion.
Voter turnout therefore may not always be a reliable indicator. Nonetheless, a high voter turnout is considered to be preferable to a low turnout because it means the government will more likely reflect the interests of a larger share of the population.
Low voter turnout implies that the democratic system may not be reflecting the interests of all citizens. Voter turnout tends to be lowest among youth, those who are less educated, and those in lower income brackets.
How is voter turnout measured?
Voter turnout is measured as the total number of votes cast as a share of the number of registered voters.
Alternatively, voter turnout may be calculated as the total number of votes cast as a proportion of the voting-age population. This may be considered a preferable method since “registration coverage may vary over time and between different groups of electors.”1 Indeed, the International Institute for Democracy and Electoral Assistance provides data on votes cast as a share of the voting-age population; however, it uses the total voting-age population, including people who are not necessarily eligible to vote (e.g., non-citizens). As a result, voter turnout figures could be significantly underestimated because the number of eligible electors is overestimated.
Elections Canada provides voter turnout figures using estimates of the number of Canadian citizens of voting age, which is a better reflection of voter turnout than simply using the total voting-age population. Unfortunately, comparable international data are not available.
How does voter turnout in the provinces compare to that of Canada’s peers?
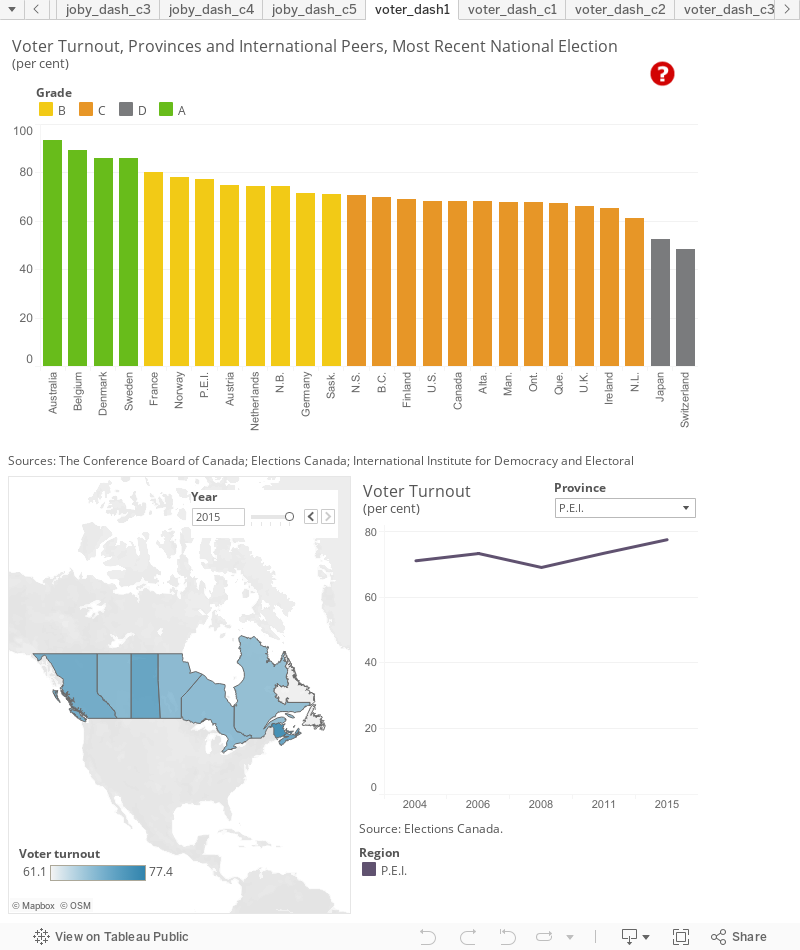
P.E.I. is the top-ranking province, scoring a “B” with a voter turnout rate of 77.4 per cent in the 2015 federal election. The province ranks just below peer country Norway (78.2). New Brunswick and Saskatchewan also get “B” grades, with voter turnout rates of 74.4 and 71.1, respectively. The highest voter turnout rates are in Australia (93.2) and Belgium (89.4)—this is not surprising given that voting is compulsory in both countries.
Most provinces are “C” performers. Nova Scotia (70.8) and B.C. (70) have voter turnout rates above the national average, while Alberta (68.2), Manitoba (67.9), Ontario (67.8), and Quebec (67.3) have voter turnout rates just below.
At 61.1 per cent, Newfoundland and Labrador has the lowest voter turnout rate among all the provinces.
Voter turnout rates vary markedly across the peer countries, from a high of 93 per cent in Australia to a low of 48 per cent in Switzerland. Overall, Canada gets a “C” on this indicator and ranks 12th among the 16 peer countries, with 68.3 per cent of Canadians voting in the 2015 election.
How do the provinces perform relative to one another?
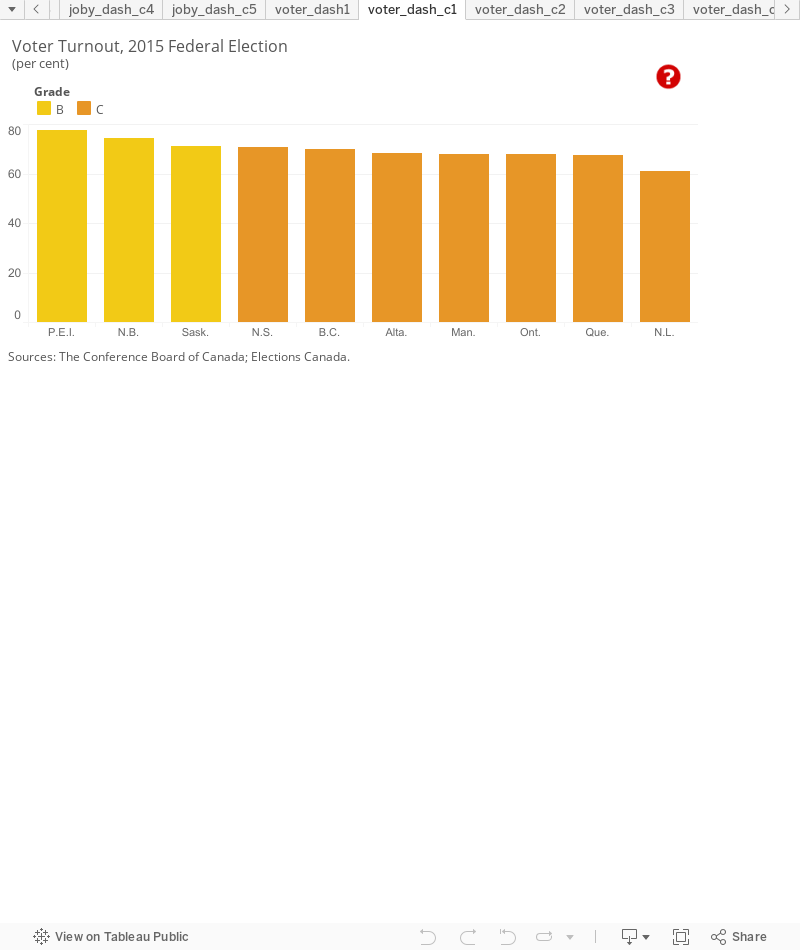
P.E.I is top-ranked in Canada, with a voter turnout rate of 77.4 per cent in the 2015 federal election. New Brunswick, Saskatchewan, Nova Scotia, and B.C. also have voter turnout rates of 70 per cent or higher. Alberta, Manitoba, Ontario, and Quebec have voter turnout rates below the national average of 68.3 per cent. Newfoundland and Labrador has the lowest voter turnout among the provinces; its voter turnout rate of 61 per cent is 16 percentage points lower than the rate in top-ranked province P.E.I.
How do the territories fare on voter turnout?
After P.E.I., Yukon had the second highest voter turnout in the 2015 federal election, at 75.5 per cent, placing the territory among the other “B” performers.
N.W.T. scores a “C” and ranks just ahead of Newfoundland and Labrador with a voter turnout of 63.4 per cent.
Nunavut is a “D” performer with the lowest voter turnout among all the provinces and territories. In the 2015 federal election, the territory had a voter turnout rate of 59.8 per cent, placing it third from the bottom among all the comparator jurisdictions. Only Japan and Switzerland fare worse.
The territories are not included in the overall provincial and international benchmarking calculations because data are not available for key indicators included in the overall society report card. The Conference Board is, however, committed to including the territories in our analysis, and so we provide information on territorial performance when data are available.
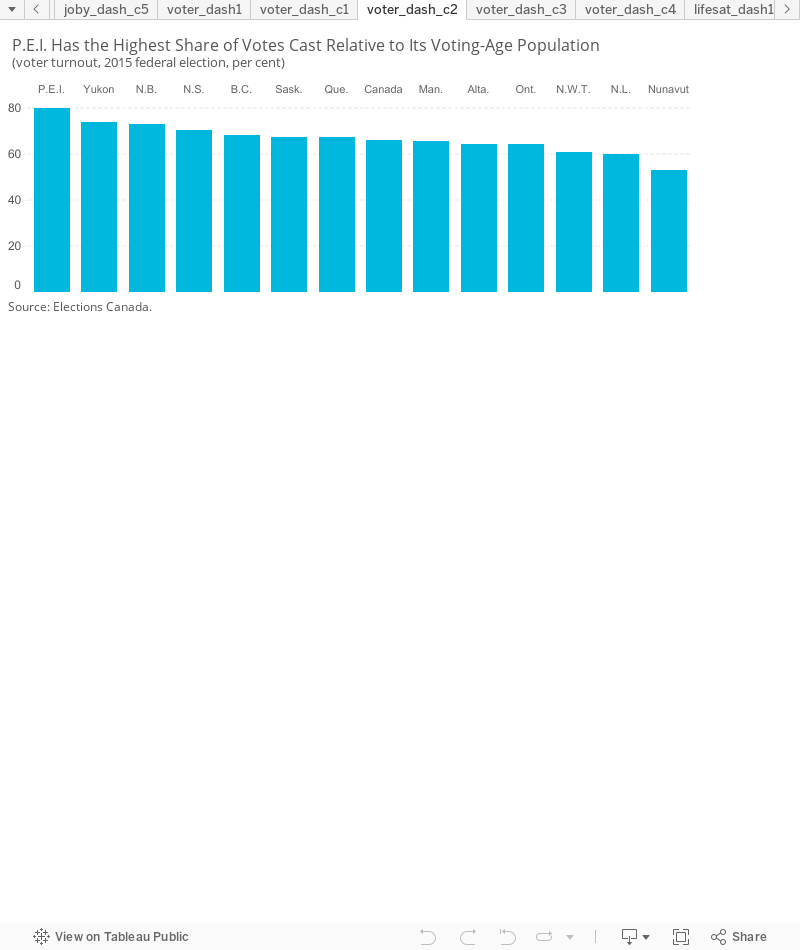
How do the provinces and territories fare if we look at votes cast relative to the voting-age population?
The rankings remain the same, for the most part, looking at the number of votes cast as a share of the voting-age population instead of as a share of the number of registered voters. P.E.I. and Yukon have the highest voter turnout numbers, while Nunavut, Newfoundland and Labrador, and N.W.T. are still at the bottom of the rankings. Quebec fares better, with a higher voter turnout than the national average. Voter turnout in Canada, calculated using voting-age population data, was 61.1 per cent in 2015—7.2 percentage points lower than the voter turnout figure calculated using the number of registered voters (68.3 per cent).
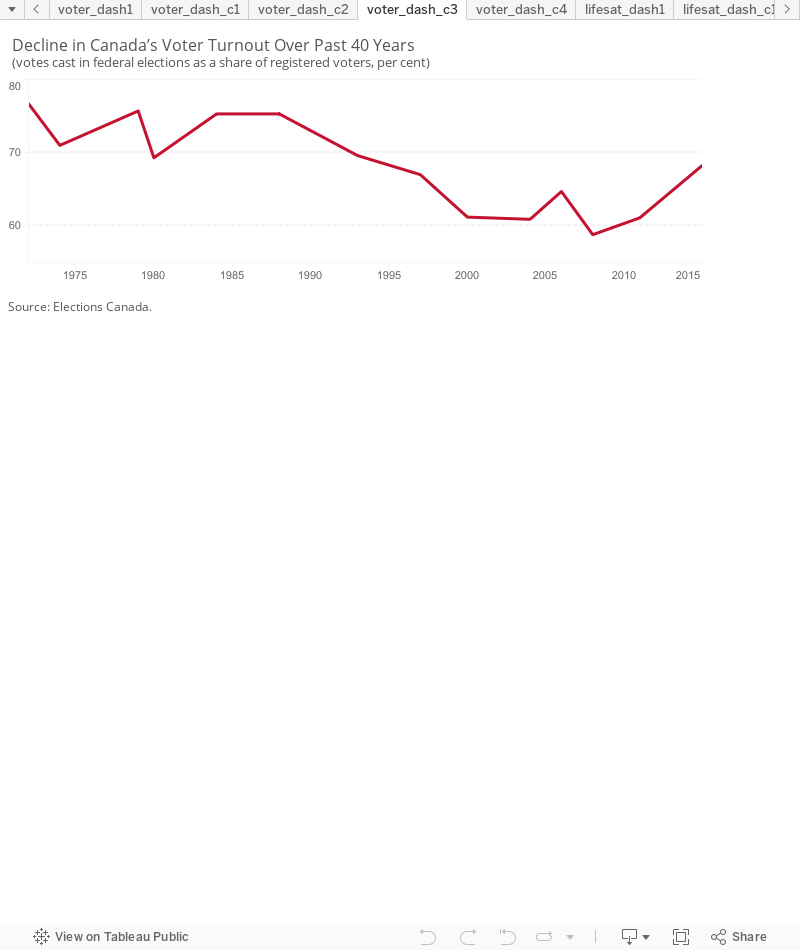
Is voter turnout declining in Canada?
Fewer Canadians are voting now than in the past; however, voter turnout did increase in the past two federal elections. In the 1970s up until the early 1990s, voter turnout ranged from a high of 76.7 per cent (1972 election) to 69.6 per cent (1993 election). In the 2008 election, participation reached an all-time low with a voter turnout rate of only 58.8 per cent. In the 2011 federal election, voter turnout increased slightly to 61.1 per cent—still much lower than the turnout rates of the past.
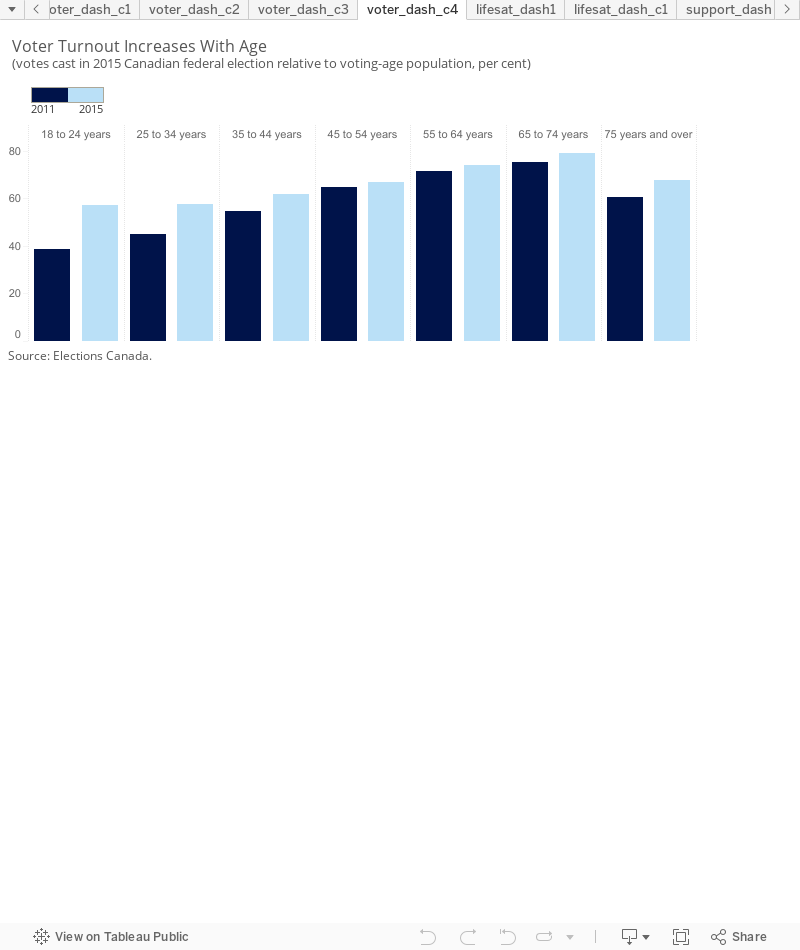
The 2015 election saw an even greater increase in participation, with a voter turnout of 68.3 per cent—7.2 percentage points higher than in the 2011 election and on par with rates in the 1990s. This increase, in part, was due to higher participation from younger voters. The voter turnout rate among those aged 18 to 24 jumped 18 percentage points, from 39 per cent in 2011 to 57 per cent in 2015—a 47 per cent increase. There were also notable increases in the voter turnout rates for those aged 25–34 and 35–44 (12 and 7 percentage points, respectively).2
The territories had among the highest growth in voter turnout rates between the 2011 and 2015 elections, with increases ranging from 9.5 percentage points in N.W.T. to an impressive 13.7 percentage point jump in Nunavut. Indeed, Nunavut’s voter turnout rate increased by 30 per cent, from 45.7 per cent in 2011 to 59.4 in 2015. These results may partly reflect the increase in Aboriginal participation rates.3 Among the provinces, Alberta had the greatest increase in voter turnout, with a leap from 55.8 per cent in 2011 to 68.2 per cent in 2015.
The voting rate of immigrants increased by 6 percentage points between the 2011 and 2015 elections.4
Why are Canadians not voting?
Statistics Canada added questions about voter participation to its Labour Force Survey in 2011 for the first time and then again in the November 2015 Labour Force Survey.
The 2011 survey revealed that 28 per cent of non-voters were “not interested in voting,” which includes “feeling that their vote would not have made a difference in the election results.” The next top-cited reason (23 per cent of non-voters) was “too busy,” which includes having “family obligations or having a schedule or conflict at work or school.” In 2015, 31.8 per cent of non-voter respondents were “not interested in politics,” while 23.5 per cent reported being “too busy.”5
Voter turnout also increases with age. Younger people have much lower voter turnout rates. In 2011, only 38.8 per cent of eligible voters aged 18 to 24 voted, while 45.1 per cent of eligible voters aged 25 to 34 cast a ballot. While voter turnout increased to 57 per cent in for both cohorts in the 2015 election, the numbers remain relatively low. Conversely, voter participation among older people is much higher: 72.8 per cent among eligible voters aged 55–64 and 77.6 per cent for those aged 65–74 in 2015.6
Education also affects voter turnout. According to Labour Force Survey results, in the 2015 election, 86 per cent of individuals with a university degree reported casting a ballot, versus 67 per cent for those without a high school diploma.7
Why is voter turnout so low in N.W.T. and Nunavut?
Voter turnout is lower among Aboriginal populations than among non-Aboriginal populations—this helps explain the low turnout rates in N.W.T. and Nunavut, where the shares of the Aboriginal population are 51.9 per cent and 86.3 per cent, respectively.
A 2011 Elections Canada study examining determinants of Aboriginal electoral turnout (both on and off reserves), as well as factors affecting non-Aboriginal turnout, reported common patterns among both populations. Looking at survey data from the 2004, 2006, 2008, and 2011 federal elections, the analyses showed that Aboriginal turnout increases with age, education, and income—just as it does for non-Aboriginal populations. Also, Aboriginal people are more likely to vote when they are better politically informed and have a greater sense of civic duty—factors that also affect voter participation among non-Aboriginal populations. Finally, Aboriginal voter turnout is also affected by residence on or off a First Nations reserve, with off-reserve populations having higher rates. The report indicates that voter turnout among Aboriginal people would be 20 percentage points higher if their profile on all these determinants (residence, age, education, income, political resources, and civic duty) matched that of non-Aboriginal people.8
On an encouraging note, voter turnout in the 2015 election was notably higher in both N.W.T. and Nunavut, with Nunavut having the greatest increase in voter turnout among all provinces and territories.
What accounts for the low voter turnout in Newfoundland and Labrador?
In the 2015 federal election, only 61.1 per cent of registered voters in Newfoundland and Labrador cast a ballot. While this is a marked improvement over the voter turnout in the previous election (52.6 per cent in 2011), it is the still the lowest turnout rate among the provinces and at the bottom of the pack among all comparator jurisdictions.
Voter age is not likely the main factor behind low voter turnout, given that Newfoundland and Labrador has one of the oldest populations in Canada, with a median age of 45.9 Still, voter turnout in the province is dismally low for younger people. In the 2015 election, the voter turnout rates among those aged 18 to 24 and 25 to 34 were both 47.5 per cent. This is much lower than the voter turnout rates among those aged 55 to 64 (69 per cent) and 65 to 74 (72.6 per cent), although even these are below the national average.
Socio-economic factors may play a role. While per capita incomes in the province are among the highest in Canada, the province fares poorly on measures of equity. Newfoundland and Labrador scores a “B” on income inequality, ranking 6th among the provinces and 17th among all 26 jurisdictions. The province also has the highest gender wage gap among all jurisdictions. So, income inequality in the province could be contributing to voter apathy.
Education, another key factor in voter turnout, may also play a role in the province. The province ranks low on indicators of educational attainment—it has the lowest share of the population with a high school diploma and the second-lowest share with a university degree among the provinces.
How can voter participation in Canada be increased?
One way to increase voter turnout and remove turnout biases related to socio-economic status is to introduce compulsory voting. For example, in Australia, where voting has been compulsory since in 1924, non-attendees face a fine of AU$20.10
However, the question remains as to whether or not it is democratic to use financial or social sanctions to compel citizens to turn out to vote.11 Also, compulsory voting could lead to a higher number of invalid and blank votes, as well as “random” votes—in other words, those voting against their free will may just check off a candidate at random.12
Given that turnout is lowest among younger people, there must be a greater effort to increase voter participation among youth. According to findings from Elections Canada’s 2015 National Youth Survey, young Canadians reported both access and motivational barriers to voting in the federal election. Youth reported being less aware of voting options, with only one-third aware of the option of voting at advanced polls, compared with 65 per cent of older adults. Also, fewer youth (76 per cent) reported having received a voter identification card compared with older adults (94 per cent). With respect to motivation, a smaller share of young adults believed they could make a difference by voting (74 per cent versus 86 per cent for older adults) and almost half of the younger respondents agreed with the statement “I do not think government cares much about what people like me think.” Finally, older adults seemed to have more political knowledge, with 65 per cent able to answer four out of five knowledge-testing questions correctly, compared with only 45 per cent of youth.13
A 2003 report for Elections Canada on declining voter turnout offered a number of ways to increase voter participation among young people, including:
- making voting easier and more meaningful for first-time voters
- making politics more relevant to the young
- providing them with the tools they need to understand its relevance to their own lives
- engaging them more directly in the political process14
Although youth turnout rates remain low, much progress was made in the last election. Elections Canada’s pilot advanced polling project helped by making student voting easier. For the 2015 federal election, voting offices were opened at 39 campuses (university, college, and CEGEP) across the country. These offices provided information on the election, registering, and voting.15 The pilot project also aimed to make voting easier for Aboriginal populations living in urban centres by opening voting offices at 13 Friendship Centres, that is, centres that help Aboriginal people living in cities access vital services.
Footnotes
1 Elections Canada, Estimation of Voter Turnout by Age Group and Gender at the 2011 Federal General Election (accessed July 27, 2016).
2 Sharanjit Uppal and Sébastien LaRochelle-Côté, Understanding the Increase in Voting Rates Between the 2011 and 2015 Federal Elections (Ottawa: Statistics Canada, October 12, 2016) (accessed October 20, 2016).
3 Ibid.
4 Ibid.
5 Elections Canada, Turnout and Reasons for Not Voting During the 42nd General Election: Results From the Labour Force Survey (accessed July 27, 2016).
6 Elections Canada, Voter Turnout by Age Group (accessed July 27, 2016).
7 Sharanjit Uppal and Sébastien LaRochelle-Côté, Understanding the Increase in Voting Rates Between the 2011 and 2015 Federal Elections (Ottawa: Statistics Canada, October 12, 2016) (accessed October 20, 2016).
8 Patrick Fournier and Peter John Loewen, Aboriginal Electoral Participation in Canada (Elections Canada, November 2011), 32.
9 Statistics Canada, Annual Demographic Estimates: Canada, Provinces, and Territories, September 2015, 56.
10 Australian Electoral Commission, Voting Within Australia—Frequently Asked Questions: What Happens if I Do Not Vote? (accessed April 14, 2015).
11 Simon Jackman, “Compulsory Voting,” International Encyclopedia of the Social and Behavioral Sciences (Oxford, U.K.: Elsevier, 2001).
12 Institute for Democracy and Electoral Assistance, Compulsory Voting (accessed April 14, 2015).
13 Elections Canada, 2015 National Youth Survey, (accessed July 27, 2016).
14 Jon H. Pammett and Lawrence LeDuc, “Confronting the Problem of Declining Voter Turnout Among Youth,” Electoral Insight, July 2003 (accessed April 14, 2015).
15 Elections Canada, Voting at Select Campuses, Friendship Centres, and Community Centres During the 2015 Federal Election (accessed July 27, 2016).