
High-School Attainment
Key Messages
- Nine out of ten Canadian provinces earn either “A” or “A+” grades for the percentage of their population with at least a high-school diploma.
- British Columbia, Ontario, and Alberta get “A+” grades because they score higher than all of Canada’s peer countries.
- High-school attainment rates are rising; in every province, at least 90 per cent of people between the ages of 25 to 34 have graduated from high school.
Putting high-school attainment in context
A high-school diploma is the prerequisite stepping stone to post-secondary education, which is increasingly deemed essential to success in the labour market. There is plenty of evidence that well-educated citizens are more actively engaged in society: they tend to make better choices about factors that affect their quality of life (e.g., diet, smoking, exercise); and they earn higher incomes than those who are less educated. Less prominent in the mind of the public, but equally well-known among decision-makers, is the fact that well-educated and skilled people make important contributions to business innovation, productivity, and national economic performance. In an interconnected global economy, provinces and countries with more highly skilled workers have a distinct competitive advantage.
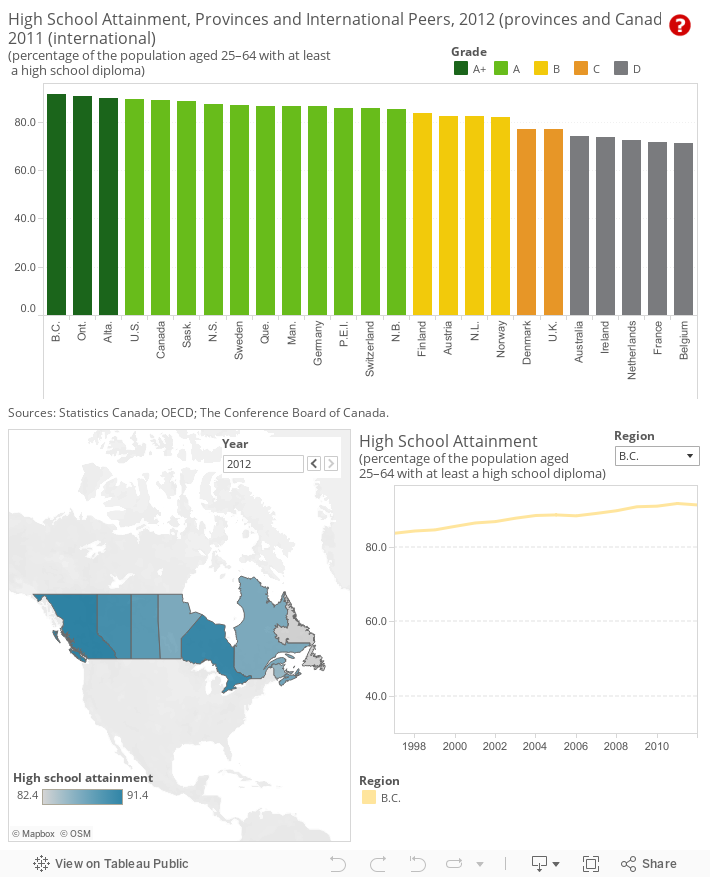
How do provincial high-school attainment rates compare internationally?
Overall, provincial high-school attainment rates compare very favourably with Canada’s peer countries. Nine out of ten provinces earn either an “A” or an “A+” on high-school attainment. British Columbia, Ontario, and Alberta get “A+” grades because they have higher high-school attainment rates than any of Canada’s peer countries. Only Newfoundland and Labrador earns a “B.”
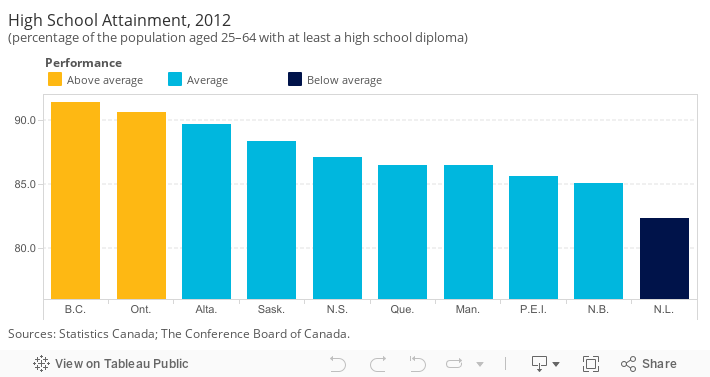
How do the provinces perform relative to each other?
In addition to ranking the provinces against Canada’s international peers, the provinces have been compared with each other and placed into three categories: “above average,” “average,” and “below average.”1
British Columbia and Ontario stand out as having higher-than-average high-school attainment rates; Newfoundland and Labrador scores below average. However, Newfoundland and Labrador’s share of the population with at least a high-school diploma is still higher than more than half of Canada’s peer countries, including Norway, the U.K., and the Netherlands.
How have provincial high-school attainment rates changed over time?
Between 1997 and 2012, all the provinces improved their high-school attainment rates relative to the international peers. While Canada was an “A” performer overall during the entire period, seven provinces were not “A” performers relative to the international peers in 1997. Of those seven, only one—Newfoundland and Labrador—still had not achieved an “A” grade by 2012. Yet that province had one of the most dramatic improvements, increasing its high-school attainment rate by 15.3 percentage points (from 67.1 in 1997 to 82.4 in 2012).
The largest improvement was in P.E.I., where the high-school attainment rate jumped by 16.5 percentage points (from 69.1 per cent to 85.6 per cent), taking it from a “B” to an “A.” The smallest increases were in Alberta and British Columbia, but these provinces had relatively large attainment rates in 1997, so they had less room to improve.
Across the country, Canadians have made high-school attainment a priority. This accomplishment is driven less by official policy than by labour force entry-level requirements, social expectations (parents not wanting their children “left behind”), and overall prosperity (which reduces the need for early labour force entry). The education system has certainly encouraged “stay in school” programs, but broader economic and social factors have been more important than policy in contributing to Canada’s impressive performance on this indicator.
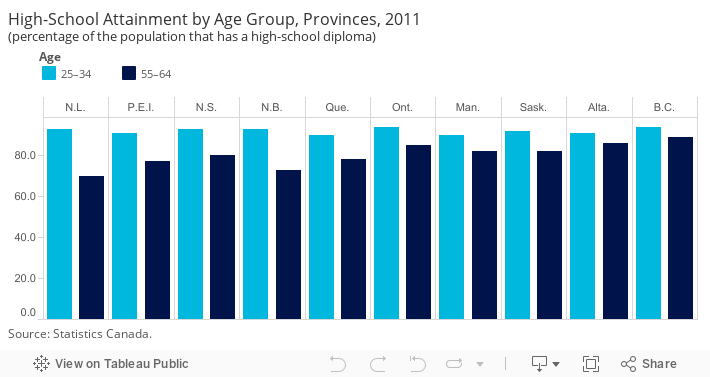
How do different age groups rank on high-school attainment?
In general, younger age groups have higher attainment rates—especially in Canada. If the international peers are ranked solely on the share of people aged 25 to 34 years who have completed high school, Canada moves into first place in 2011—moving ahead of the United States—and Sweden takes second place.2
If the provinces are ranked against the international peers solely on this younger age group, four provinces become “A+” performers (because they rank higher than the top-ranked peer country, Canada) and all other provinces become “A”s.
How are Canada’s Aboriginal peoples faring on high-school attainment?
Despite Canada’s overall excellent performance on high-school attainment, First Nations, Métis, and Inuit people still have comparatively poor attainment rates. While accurate data are difficult to obtain for these populations, the 2011 National Household Survey can provide some insights. Among 25–34 year olds who identified as Aboriginal, the national high-school attainment rate was 72 per cent, compared with 92 per cent for all Canadians. Aboriginal residents of Nova Scotia aged 25–34 reported the highest attainment rate, at 85 per cent, while the lowest rate was recorded for Manitoba, at 64 per cent. Given that several reserves were not completely enumerated and taking into account that Aboriginal people had lower attainment rates for the survey in general, it is possible that attainment rates are lower than reported in the survey.
Improving high-school attainment for Aboriginal youth is currently an area of focus for Aboriginal peoples and communities, as well as federal and provincial governments. British Columbia is one province that has been recognized as a leader in First Nations education. At 77 per cent among Aboriginal people aged 25–34, B.C. has the highest rates of high-school attainment among the six provinces with large Aboriginal populations (the other five being Alberta, Saskatchewan, Manitoba, Ontario, and Quebec). Reserve schools in the province more effectively coordinate with each other and with provincial school systems.3 More work still needs to be done to ensure that First Nations, Métis, and Inuit populations achieve the same high levels of high-school attainment as the rest of Canada’s population.
Is a high-school diploma still good enough?
Canadian high-school graduates who enter the labour force directly are not faring as well now as in previous generations. A high-school diploma used to be adequate for most jobs, including many well-paid jobs. The growing complexity of work in the global knowledge economy and the rising rates of post-secondary attainment in Canada, however, have reduced the relative value of a high-school diploma. Many employers now specify post-secondary education as a minimum qualification for employment, even if a degree or college diploma exceeds the actual skills requirements of their entry-level jobs.
What skills do students need to successfully make the transition to work?
The Conference Board has developed an employability skills profile that outlines the skills, attitudes, and behaviours that individuals need to participate and progress in today’s dynamic world of work. Understanding and applying these skills will help individuals to enter, stay in, and progress in the world of work.
The Conference Board has also developed an employability skills toolkit—a suite of practical tools to help individuals identify and reflect on their skills, plan skills development activities, implement development plans and practise their skills, and document and market their skills for best success.
Interested in accessing these documents?
- Employability Skills 2000+, Ottawa: The Conference Board of Canada.
- Employability Skills Toolkit, Ottawa: The Conference Board of Canada.
Footnotes
1 To compare the performance of Canadian provinces relative to one another, we first determined the average score and standard deviation of the provincial values. The standard deviation is a measure of how much variability there is in a set of numbers. If the numbers are normally distributed (i.e., the distribution is not heavily weighted to one side or another and/or does not have significant outliers), about 68 per cent will fall within one standard deviation above or below the average. Any province scoring one standard deviation above the average is “above average.” Provinces scoring less than the average minus one standard deviation are “below average.” The remaining provinces are “average” performers.
2 Data breaking down high-school attainment by age groups are not yet available for 2012.
3 John Richards, Why Is B.C. Best? The Role of Provincial and Reserve School Systems in Explaining Aboriginal Student Performance, Commentary No. 390 (Toronto: C.D. Howe Institute, 2013).