
University Attainment
Key Messages
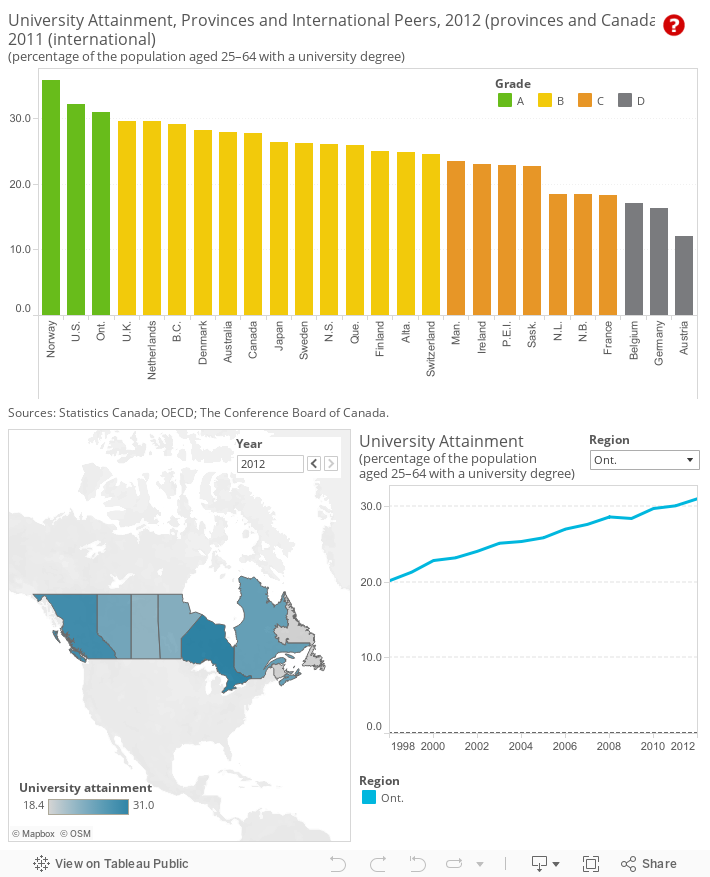
- Ontario is the sole province with an “A” grade on university attainment, ranking behind only Norway and the United States.
- All provinces increased their population share of university graduates in the past 15 years.
- University attainment rates among those aged 25–34 are rising more rapidly in international peer countries than in most Canadian provinces, so it is unlikely that many provinces will close the gap anytime soon.
Putting university graduates in context
The share of the population with a university degree has been trending upwards in Canada and internationally. Well-educated citizens are more actively engaged in society: they tend to make better choices about factors that affect their quality of life (e.g., diet, smoking, exercise); and they earn higher incomes than those who are less educated. Less prominent in the mind of the public, but equally well-known among decision-makers, is the fact that well-educated and skilled people make important contributions to business innovation, productivity, and national economic performance. In an interconnected global economy, countries (and provinces) with more highly skilled workers have a distinct competitive advantage.
How do the provinces fare on university attainment relative to Canada’s international peers?
Ontario is the only province with an “A” grade on university attainment. Thirty-one per cent of working age Ontarians have graduated from university, putting the province behind Norway’s rate of 36 per cent and the U.S. rate of 32 per cent. Four provinces were “B” performers and five earned a “C.”
It is important to note that countries (or provinces) that do very well on college attainment will likely not do as well on university attainment. The total percentage of college and university graduates in a country cannot exceed 100 per cent; therefore, at a certain point, increasing rates of graduates from one type of institution will decrease rates for the other type. This is the case, for example, in Norway, which ranks last on college attainment but first on university attainment.
How do provinces perform relative to each other?
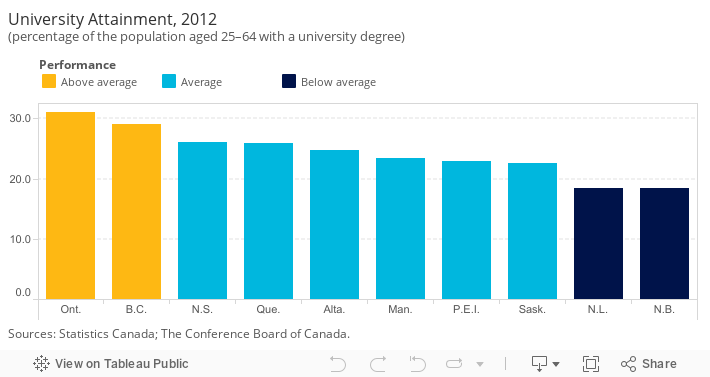
In addition to ranking the provinces against Canada’s international peers, the provinces have been compared with each other and placed into three categories: “above average,” “average,” and “below average.”1
Ontario and British Columbia are considered above average on university attainment, while Newfoundland and Labrador and New Brunswick are classified as below average. In 2012, the share of the working-age population with a university degree in Ontario was 12.6 percentage points higher than in New Brunswick.
Have provincial university attainment rates increased over time?
Since 1998, Canada has earned a “B” for its share of population with a university degree. The provinces have had slightly more variability. Nova Scotia and Ontario have both moved up a letter grade, while Manitoba has moved up and down a letter grade and is currently a “C” performer.
Overall, Canada’s university attainment rate grew from 18 per cent in 1998 to nearly 27 per cent in 2011, but it is not the only peer country with success in this area. Canadian provinces must continue to increase their rates merely to maintain their ranking.
Can trailing provinces close the gap with leading provinces and countries?
One way to answer this question is to examine the attainment rate of the younger age group—those ages 25–34. A greater increase in the rate for a poorly performing province would mean that, over time, the gap between that province and the leading provinces and countries would shrink.
But many of the provinces will have a difficult time catching up to the leaders. Looking at the younger age cohorts, seven countries have higher shares of university attainment among 25–34 year olds than the highest-ranking Canadian province.2 Norway will likely retain its top position for some time.
The U.S., however, appears to be losing ground. The share of its population aged 25–34 years old with a university degree is just 33 per cent, leaving it tied for eighth place among the peer countries, even with Denmark. The challenge for the U.S. is that attainment rates have not experienced the same increase in the younger cohorts. At 33 per cent, the share of 25–34 year olds with a university degree is only 2 per cent higher than that for Americans aged 55–64. At present, the younger U.S. cohort is 13 percentage points behind Norway. Although the U.S. used to be a leader on this measure, that position is being threatened.
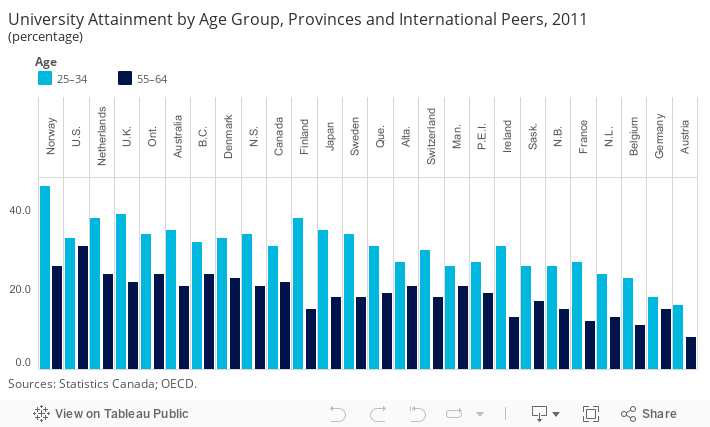
Among the provinces, Nova Scotia and Ontario are tied with the highest share of population age 25–34 with a university degree (34 per cent), which is still 12 percentage points behind Norway. The younger age cohort in Nova Scotia has substantially increased its attainment rate compared with 55–64 year olds.
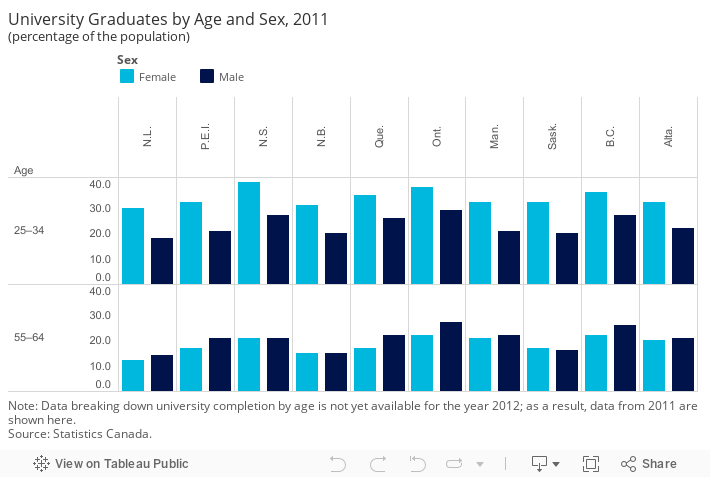
Comparing attainment rates across age cohorts highlights the increasing gender divide. Most of the increase in the percentage of university graduates aged 25–34 is due to the much higher rates for women.
One group that has not significantly increased its rate of university attainment is Aboriginal peoples. Across Canada, 9 per cent of Aboriginal people between the ages of 55 and 64 and 11 per cent of 25–34 year olds had a university degree in 2011.3 The rates are somewhat higher for the Métis, where 16 per cent of 25–34 year olds have a university degree, compared with 8 per cent for First Nations and 5 per cent for Inuit. Even though low high-school attainment rates are a barrier to post-secondary education for some Aboriginal youth, higher rates of college attainment among Aboriginal people indicate that increasing university attainment should be similarly achievable.
Is a university degree better than a college diploma?
It has long been argued, based on income data, that a university degree is the most relevant indicator of Canada’s ability to produce highly talented, innovative people. The “returns on education” data support this argument, since university graduates, as a group, earn more, on average, than college graduates.
However, more university graduates are seeking a college diploma after obtaining their degree. In 2000, 10 per cent of college graduates had previously completed a university degree.4 In 2005, that number rose to 13 per cent.5 This increase may reflect the value seen in the applied programs offered by colleges. Further research is needed to determine at which point in time university graduates enrol in college programs (e.g., do they enrol right after graduation from university or mid-career), and what types of programs they are taking (e.g., an extension of their undergraduate course or a complete career change).
Recent research suggests the field of study may be more important than the type of academic institution attended. One study, for example, found that men with university degrees in academic disciplines—such as the humanities, biology, and agriculture science—earned less than half of that earned by men with university degrees in vocational and applied disciplines—such as commerce, medicine, and engineering.6 Another study identified similar differences in earnings for college disciplines in Canada and found that these discrepancies drove enrolments toward disciplines with higher earnings expectations.7
Perhaps the distinction between college and university is less important than the relevance of the discipline to the workplace, since it is relevance—along with supply and demand—that sets the market price for skilled talent.
Footnotes
1 To compare the performance of Canadian provinces relative to one another, we first determined the average score and standard deviation of the provincial values. The standard deviation is a measure of how much variability there is in a set of numbers. If the numbers are normally distributed (i.e., the distribution is not heavily weighted to one side or another and/or does not have significant outliers), about 68 per cent will fall within one standard deviation above or below the average. Any province scoring one standard deviation above the average is “above average.” Provinces scoring less than the average minus one standard deviation are “below average.” The remaining provinces are “average” performers.
2 Data breaking down university completion is not yet available for the year 2012. OECD, Education at a Glance 2013 (Paris: OECD Publishing, 2013), and Statistics Canada, Education Indicators in Canada: An International Perspective 2013 (Ottawa: Statistics Canada, 2014).
3 Statistics Canada, National Household Survey, 99-012-X2011046.
4 Mary Allen and Chantal Vaillancourt, Class of 2000: Profile of Postsecondary Graduates and Student Debt. Catalogue no. 81-595-MIE—No. 016 (Ottawa: Statistics Canada, 2004).
5 Justin Bayard and Edith Greenlee, Graduating in Canada: Profile, Labour Market Outcomes and Student Debt of the Class of 2005, Catalogue no. 81-595-M—No. 074 (Ottawa: Statistics Canada, 2009).
6 Alan Stark, Which Fields Pay, Which Fields Don’t? An Examination of the Returns to University Education in Canada by Detailed Field of Study (Ottawa: Department of Finance Canada, February 2007).
7 Brahim Boudarbat, Earnings and Community College Field of Study Choice in Canada, Discussion paper (Bonn: Institute for the Study of Labour, May 2004).