
Adult Literacy Rate—High-Level Skills
Key Messages
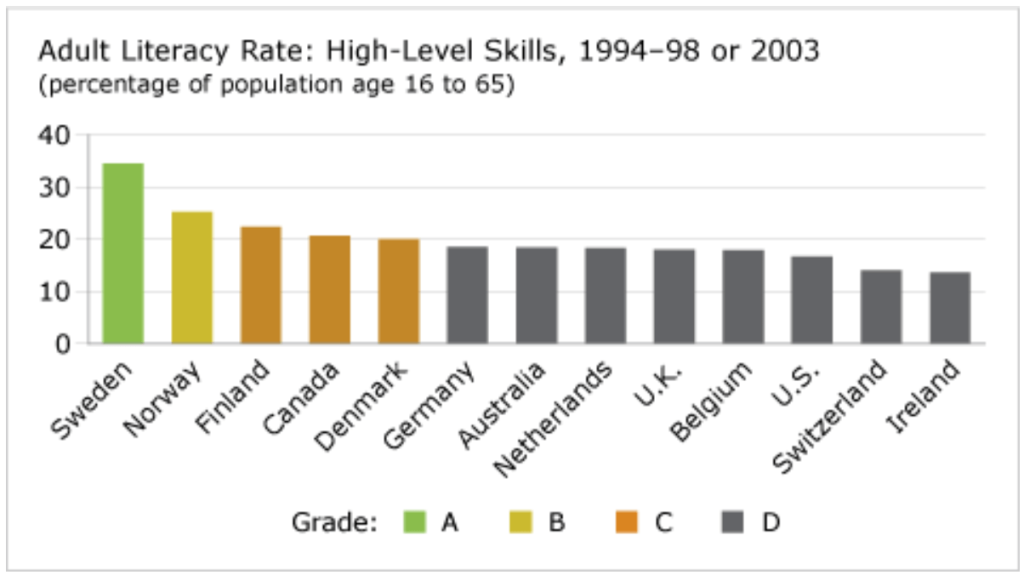
- Canada gets a “C” and ranks 4th out of 13 countries on the percentage of adults scoring high on adult literacy rate tests.
- Between 1994 and 2003, the proportion of Canadian adults with high literacy skills fell from 24 per cent to 20 per cent.
- Literacy skills erode if they are not used. Adults must engage in formal or informal lifelong learning to maintain their skills.
Putting the adult literacy rate in context
The results of international adult literacy surveys dispel the old notion that individuals are either literate or illiterate. There is no arbitrary standard distinguishing adults who have or do not have skills. Instead, skills are defined along a continuum of proficiency that can be used to denote how well adults use information to function in society and the economy.1 Adult literacy survey results show a strong link between literacy and a country’s economic potential.
The International Adult Literacy Survey (IALS) was a seven-country initiative—including Canada—first conducted in 1994. The idea was to create a comparative adult literacy rate for adults aged 16 to 65. Second and third waves of data were collected for 16 additional countries in 1996 and 1998, leading to a data set for 23 countries. Bermuda, Canada, Italy, Norway, Switzerland, the United States, and the Mexican State of Nuevo Leon participated in another survey, the Adult Literacy and Life Skills Survey (ALLS) in 2003. The varying participation in the IALS and ALLS surveys means our comparison is based on the most recent test for each country. For most, this is the IALS survey, but for Canada, Norway, Switzerland, and the United States, the results are from the ALLS survey.
Three categories of literacy were tested:
- Prose literacy: the ability to understand and use information from texts such as editorials, news stories, poems, and fiction.
- Document literacy: the ability to locate and use information from documents such as job applications, payroll forms, transportation schedules, maps, tables, and graphs.
- Quantitative literacy: the ability to perform arithmetic functions such as balancing a cheque book, calculating a tip, or completing an order form.
An average of the results from these three literacy categories is used in the Conference Board’s ranking system.
Participants’ skills were rated on a continuous scale from level 1 to level 5. Those at levels 4 and 5 had high literacy skills, and were able to integrate several sources of information or solve more complex problems. One of the most difficult tasks on the quantitative scale required participants to use a table providing nutritional analysis of food to determine the percentage of calories in a Big Mac that comes from total fat.
How do the literacy skills of adults in Canada compare to those in its peer countries?
Canada is a “C” performer on the percentage of adults that scored high on adult literacy rate tests. While only 21 per cent of adult Canadians have high literacy skills, Sweden, which leads by a large margin, has nearly 35 per cent of adults scoring high on the literacy test.
Have the literacy skills of Canadians improved?
No. On a combined average of the document and prose literacy categories, the proportion of adults with high literacy skills fell from 24 per cent in 1994 to 20 per cent in 2003. Of the four peer countries that participated in both the 1994–98 IALS and the 2003 ALLS, the drop was most dramatic in the U.S.—from 20 per cent to 14 per cent. Both Norway and Switzerland, on the other hand, succeeded in increasing their proportion of adults with high skills.
What can Canada do to raise adult literacy skills?
Although some organizations have innovative lifelong learning programs, no broad approach is being taken to address adult literacy in Canada. Canada needs to build a “learning culture” and ensure that Canadians have access to learning opportunities throughout their working lives.
Canada ranks 8th out of 13 peer countries in the amount of time that workers participate in non-formal job-related training.2 Moreover, according to the results of the 2011 Learning and Development Outlook survey, Canadian organizations spent an average of $688 per employee, on training, learning, and development in 2010.3 This is down from $787 in 2008, and represents a decline of nearly 40 per cent since the spending peak of the early 1990s. In addition, the Learning and Development Outlook report cautions that, “while nearly one-third of organizations predicted increases in spending for 2011, the anticipated percentage of increase will not bring spending up to previous high levels.”4
Most students who graduate from high school and university do so with adequate skills. But it is not enough to have a good high-school graduate rate or university graduation rate. Literacy skills erode if they are not used—the “use it or lose it” phenomenon. If, for example, a university mathematics graduate takes a job that does not require the use of math skills, that graduate will, over time, lose proficiency in those skills. Adults must engage in formal or informal lifelong learning to maintain their skills.
Without significant efforts to improve adult literacy skills through the promotion of lifelong learning, Canada risks falling further behind countries—like Sweden, Finland and Norway—that have a strong focus on raising adult literacy skills.
Interested in learning more about workplace literacy?
- Learning and Development Outlook 2009: Learning in Tough Times, Ottawa: The Conference Board of Canada, 2009.
- The Economic Benefits of Improving Literacy Skills in the Workplace, Ottawa: The Conference Board of Canada, 2007 reprint.
- Literacy, Life and Employment: An Analysis of Canadian International Adult Literacy Survey (IALS) Microdata, Ottawa: The Conference Board of Canada, 2006.
- Profiting from Literacy: Creating a Sustainable Workplace Literacy Program, Ottawa: The Conference Board of Canada, 2005.
Footnotes
1 Statistics Canada and the Organisation for Economic Co-operation and Development, Learning a Living: First Results of the Adult Literacy and Life Skills Survey (Ottawa and Paris: Statistics Canada and OECD, 2005), 15.
2 OECD, Education at a Glance 2011, Chart C5.2 (Paris: OECD, 2011), 367.
3 Carrie Lavis, Learning and Development Outlook 2011: Are Organizations Ready for Learning 2.0? (Ottawa: The Conference Board of Canada, 2011), 13.
4 Carrie Lavis, Learning and Development Outlook 2011: Are Organizations Ready for Learning 2.0? (Ottawa: The Conference Board of Canada, 2011), 13.