
Gender Gap in Tertiary Education
Key Messages
- Canada gets a “B” and ranks 9th out of 16 peer countries.
- Canadian women aged 25 to 64 are 17 per cent more likely than Canadian men to have a tertiary education.
- The imbalance in educational attainment between Canadian men and women has increased over the past decade, raising questions about whether higher education in Canada is becoming less hospitable to male learners.
Putting Canada’s gender gap in tertiary education in context
In recent years, concerns have been raised about a growing gender gap in Canadian education. Just 20 years ago, a smaller proportion of women than men had a tertiary education, and a key challenge was to make higher education more accessible and welcoming to women. While the challenge remains in some of the mathematics, computer, and engineering disciplines, the overall gender imbalance tipped in women’s favour in Canada in the early 1990s.1
Many are asking whether there is a “boy crisis” in education and wondering what can be done to address it. In fact, a growing “boy gap” in education can be seen across OECD countries, with the problem beginning long before students reach post-secondary age. According to a recent report, “boys, as a group, rank behind girls by nearly every measure of scholastic achievement”—including reading and writing scores—and they are “also more likely to be picked out for behavioural problems, more likely to repeat a grade and to drop out of school altogether.”2
How does Canada’s performance on the gender gap in tertiary education indicator compare to those of its peer countries?
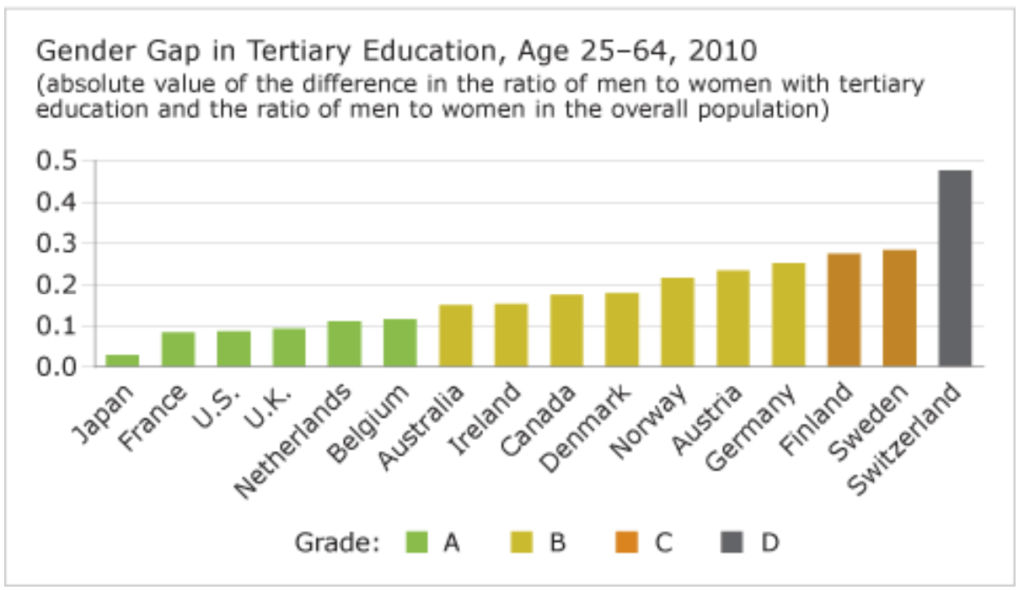
A gender gap in tertiary education indicates problems may exist in a country’s education system as a whole. Every peer country exhibits a gender imbalance in higher education of some magnitude, though some are closer to an equal distribution than others. Although Canada is awarded a respectable “B” for having only a moderate gender gap in educational attainment, it ranks 9th out of 16 peer countries. For every 100 Canadian women aged 25 to 64 who have completed tertiary education, only 83 Canadian men have.
In first-place Japan, by contrast, for every 100 women with tertiary education, a nearly equal number (103) of Japanese men have one. Five more of Canada’s peers—France, U.S., U.K., Netherlands, and Belgium—also earn “A” grades for having relatively smaller gender gaps, and Canada is also outperformed by Australia and Ireland, albeit by small margins. At the other end of the spectrum, gender imbalances of between 25 and 30 per cent are seen in Germany, Finland, and Sweden. And in lowest-ranked Switzerland, men are almost 50 per cent more likely than women to have tertiary education—a situation that reflects a more traditional (i.e., male biased) gender imbalance.
Who is doing better—men or women?
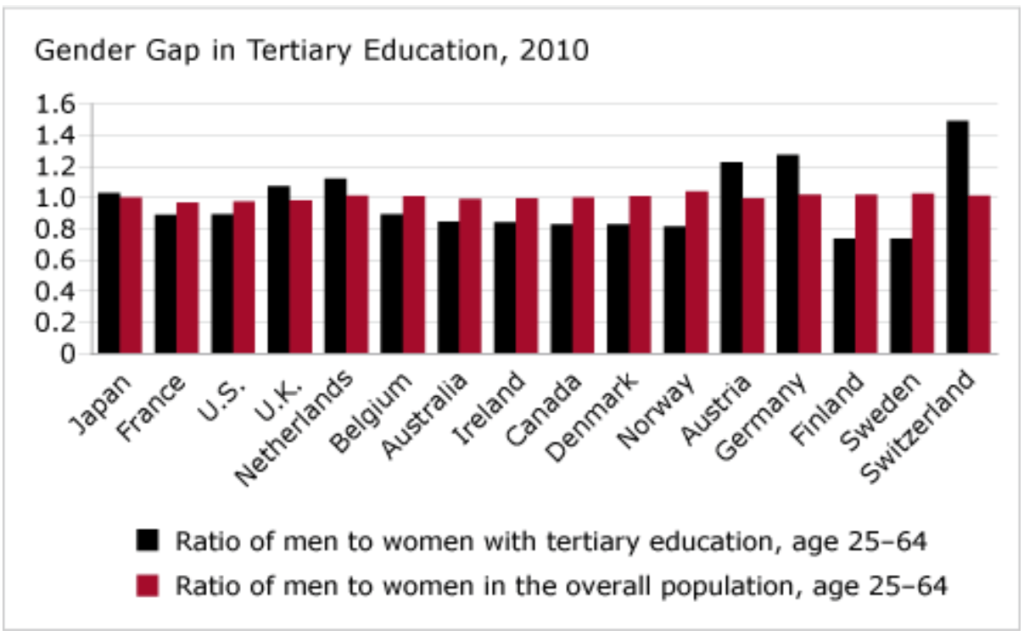
Which gender is on the disadvantaged side of the equation differs by country. In 6 of the 16 peer countries, men aged 25 to 64 are more likely than women in that age cohort to have tertiary education. This includes high-ranking Japan, U.K., and Netherlands, where the balance tips slightly in favour of men; but also poor performers Austria, Germany, and Switzerland where men are significantly more likely than women to have tertiary education. The remaining 10 countries—including Canada—have gender imbalances that favour women.
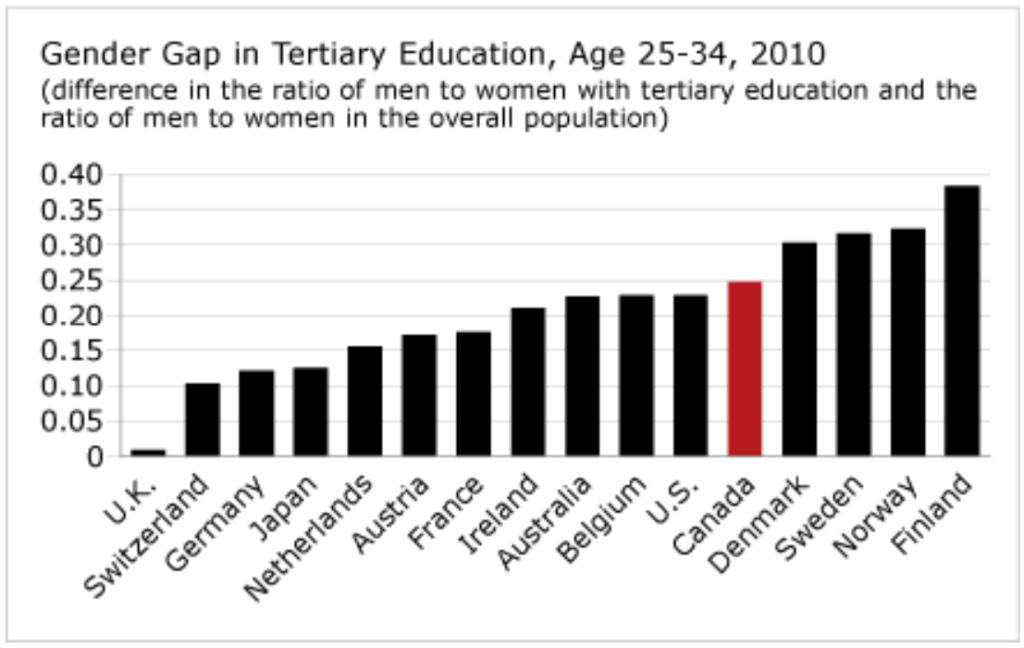
However, when we examine the more recent cohort of graduates—those aged 25 to 34—nearly every country has a gender imbalance that favours women. In most cases, moreover, women’s advantage has become much more pronounced. For every 100 Canadian women aged 25 to 34 with a tertiary education, only 75 men have one. In Finland, the ratio is a striking 100 women to 62 men. In this light, there is evidence to support rising concerns about a “boy crisis” in education.
At the same time, it is important to keep in mind that college and university are only two of many possible educational avenues. Indeed, men’s lower rate of tertiary education may be due in part to their pursuing apprenticeships and other vocational paths to lucrative careers. Moreover, although more women than men graduate overall from Canadian tertiary institutions, men still dominate many of the fields with superior employment and income prospects for graduates. For example, while women are more likely than men to be enrolled in the humanities, social and behavioural sciences, and education, men are much more likely than women to be enrolled in architecture, engineering, mathematics, and computer and information sciences.3
In short, although there is reason to be concerned about the gender gap in Canadian higher education, debate and decision-making should take into account the many variations in participation and outcomes by program and institution, and how these align with employment and income.
How does Canada’s performance rank for the younger age group?
Examining the gender gap in tertiary education for the adult population aged 25 to 64 provides an important picture of a country’s overall, long-term performance. But it is just as important to know how a younger age group—those aged 25 to 34—is faring, given that the experiences of this group provides a better sense of how the system currently performs, or has performed in more recent years.
Unfortunately, Canada slips from 9th to 12th place overall as the gender gap for those aged 25 to 34 is 0.25 (versus 0.17 among those aged 25 to 64). In other words, for every 100 Canadian men aged 25 to 34 with a tertiary education there are 125 women with the same.
How has Canada’s gender gap in tertiary education ranked over time?
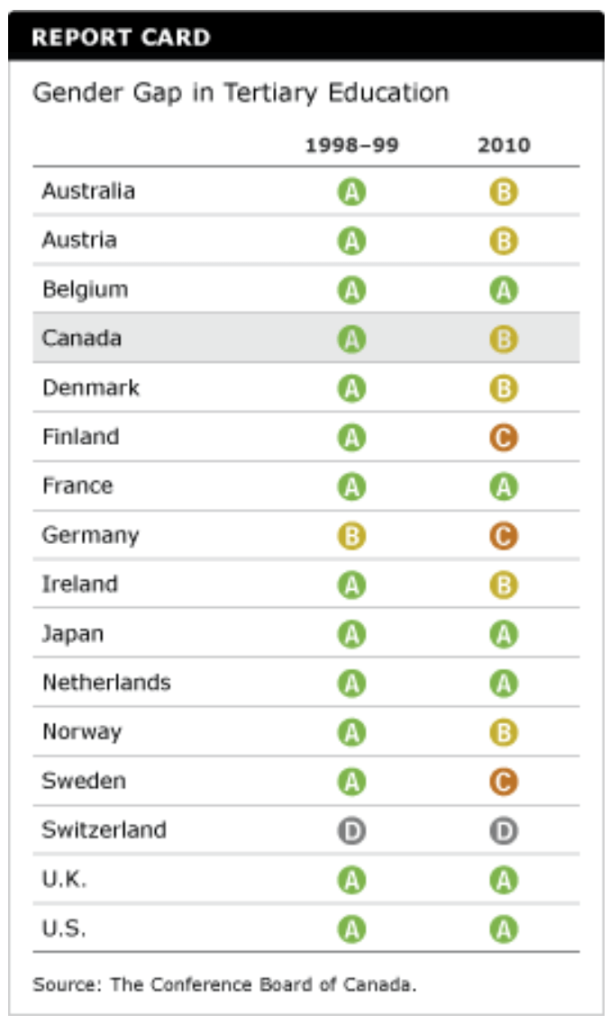
Canada deteriorated from an “A” in 1998–99 to a “B” in 2010. Whereas Canadian universities and colleges graduated 90 men for every 100 women in 1998–99, this fell to 83 men for every 100 women by 2010. While many of Canada’s peers also slipped a grade, Japan and the Netherlands not only held onto their “A” grades but also leapt over Canada in the standings by reducing the gender gaps between 1998 and 2010.
Which countries perform the best on the gender gap indicator?
Japan has the smallest gender gap in tertiary attainment among the 16 peer countries, but it has achieved this only in the last decade. In 1998–99, Japan had a much larger gap that favoured men—120 Japanese men for every 100 Japanese women attained tertiary education. But over the next decade, more women than men had tertiary education, leading to a better balance in the overall population. Whether Japan will continue to have a good gender balance, or whether the trend toward more female graduates will lead to an overall gap that favours women, remains to be seen. What is clear is that across almost all peer countries, the trend towards more female than male graduates is intensifying and producing greater gender imbalances.
If Canada wants to improve its gender balance in higher education, it will have to take steps to improve boys’ performance in elementary and secondary school and increase the rates at which they apply to, enroll in, and complete tertiary education. At the same time, Canada needs to continue to make efforts to repair gender imbalances in specific fields and programs. Action in both areas will be essential to achieving a more equitable distribution of educational opportunities and achievements, which can contribute to economic prosperity and social well-being.
Footnotes
1 Martin Turcotte, Women and Education Catalogue no. 89-503-X (Ottawa: Statistics Canada, 2011).
2 Paul Cappon, Exploring the “Boy Crisis” in Education (Ottawa: Canadian Council on Learning, 2011), 1.
3 Sun Life Assurance Company of Canada, “Studying the Difference Between Men and Women: Male vs. Female Enrolment in Canadian Colleges and Universities by Field of Study.” Based on data from Statistics Canada, Public Post-Secondary Enrolments by Institution Type, Sex, and Field of Study (CANSIM 477-0019).