
Adult Participation in Education
Key Messages
- Canada gets a “C” and ranks 10th out of 15 peer countries.
- Canada consistently underperforms in this indicator—both in terms of participation rates of adults in job-related non-formal education, and the number of hours of instruction per adult participant.
- Canadians aged 25–34 receive more job-related non-formal education than Canadians aged 55–64.
Putting Canada’s adults participation in education in context
The knowledge and skills that individuals and organizations need to be productive and efficient in today’s economy are constantly evolving and adapting. New technologies, new products and services, new markets, and new ways of doing things require that workers and employers alike invest in the development of their skills and capacities. Investing in education and training opportunities beyond one’s initial schooling years—whether for maintaining, upgrading, or repurposing the skills of a labour force—is essential in the face of increased global competition and changing demographics, as well as for tackling socio-economic imbalances like unemployment, poverty, poor health, and other social exclusions.1
What is non-formal education?
Non-formal education is broadly defined by the OECD as an “organized and sustained educational activity” that can “take place both within and outside educational institutions and caters to individuals of all ages.” It covers educational programs in adult literacy, life skills, work skills, on-the-job training, and general culture.2
How does Canada’s performance on adult participation in education compare to that its peer countries?
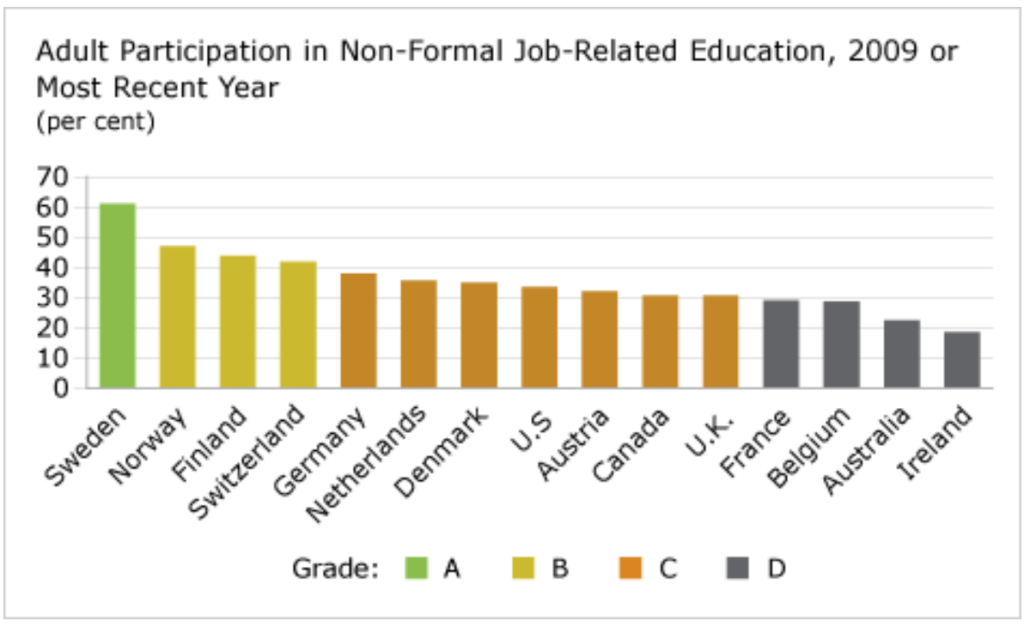
Canada ranks 10th out of 15 comparator countries—receiving a “C” grade—when it comes to adult participation rates in non-formal job-related education. This is a relatively poor placing given that Canada is an advanced economy where businesses must compete on the basis of developing new or improved products, services, models, and processes—all of which depends on having a nimble, knowledgeable, and skilled workforce.
In 2008, about 31 per cent of adult Canadians aged 25–64 received some form of non-formal job-related education. Although this is above the OECD average of 28 per cent, and higher than comparator countries such as Ireland (19 per cent), Australia (22 per cent), and France (29 per cent), Canada falls well short of a number of comparator countries including Sweden, where 61 per cent of Swedes aged 25–64 participated in non-formal job-related education—almost double Canada’s adult participation rates. Other countries that outperform Canada include Norway (47 per cent), Finland (44 per cent), Switzerland (42 per cent), and Germany (38 per cent).
Do Canadian adults receive as many hours of non-formal job-related education as their peers in other countries?
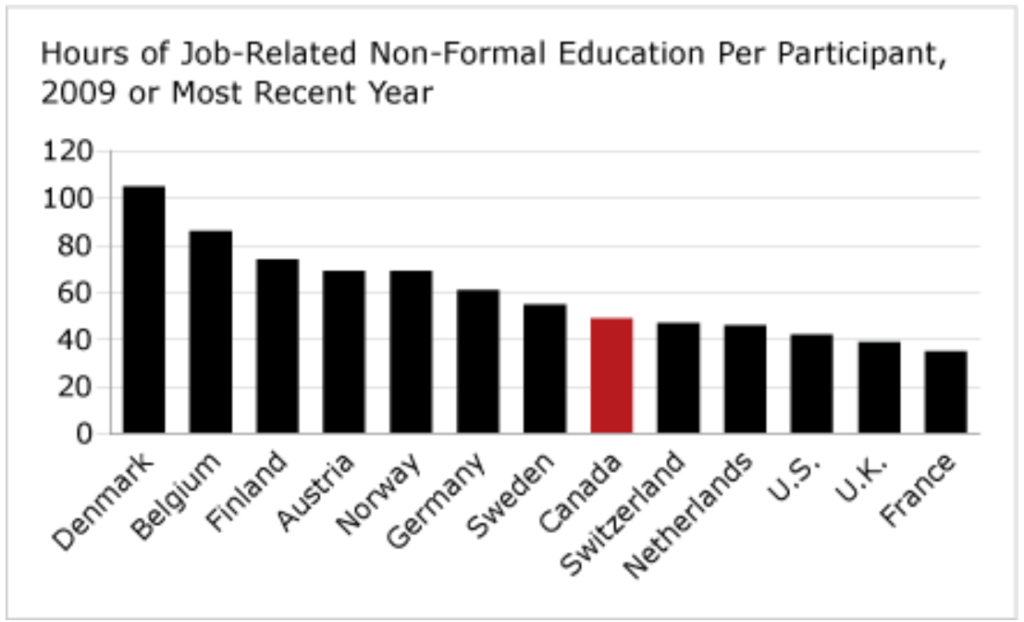
A closer look reveals that not only do Canadians aged 25–64 participate less in non-formal job-related education than their peers in other countries, they also receive, on average, far fewer hours of instruction. Canadian adults received about 49 hours of job-related non-formal education in 2008, less than half the hours of instruction received by adults in Denmark (105 hours) and well behind other peer countries including Belgium (86 hours), Finland (74 hours), Austria (69 hours), Norway (69 hours) and Germany (61 hours).
Countries with lower rates of adult participation in non-formal job-related education along with fewer hours of instruction may be at a disadvantage in terms of ensuring that their country’s current workforce has the skills, knowledge, and abilities to contribute to the productivity and competitiveness of its public and private sectors.
How has Canada’s adult participation in education changed over time?
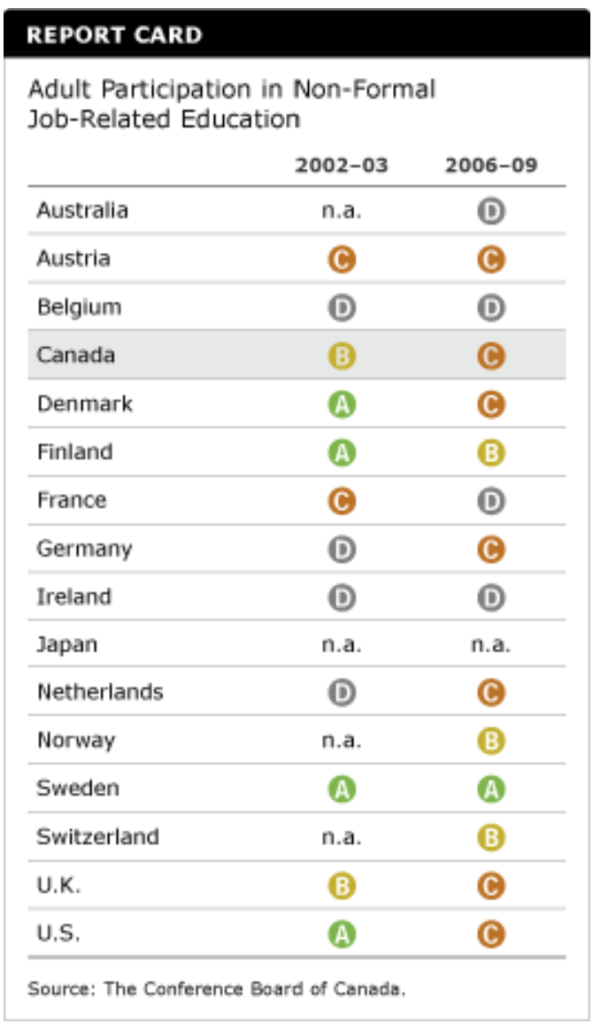
Canada received a “B” in the earlier survey of adult participation in non-formal job-related education. This fell to a “C” in the most recent survey. Canada is a consistent underperformer on this indicator, much to the chagrin of many human resources professionals, proponents of workplace literacy skills development, public and private educators, workers, and labour.
Does adult participation in adult education vary by age group?
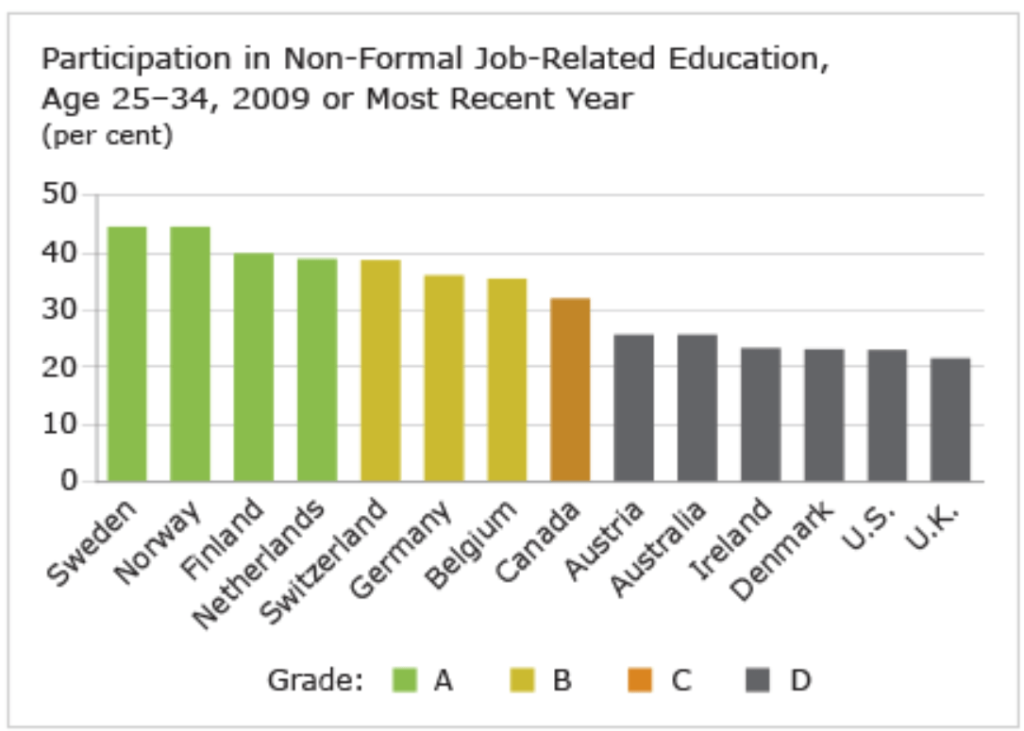
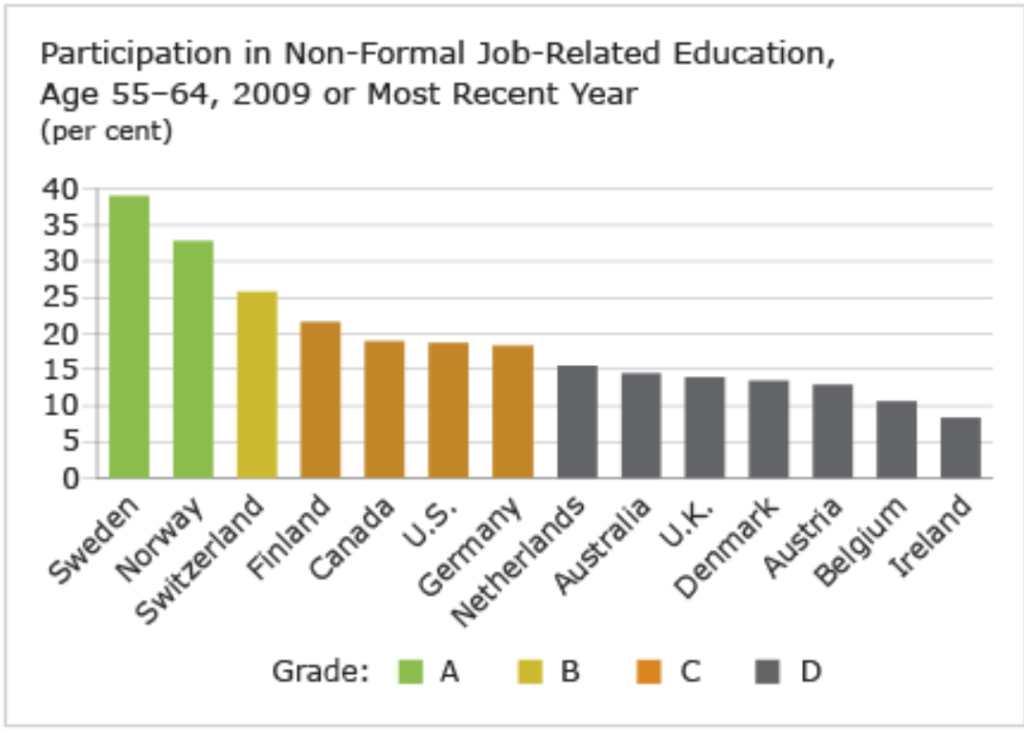
Across all comparator countries, younger adults—those aged 25–34 years—participate more in non-formal job-related education than older adults—those aged 55–64. In Canada, 32 per cent of Canadian adults aged 25–34 partake in non-formal job-related education, compared with just 19 per cent of Canadian adults aged 55–64.
Among comparator countries, Canada places 8th out of 14 countries, and receives a “C” grade, for the share of younger adults participating in non-formal job-related education and training. It ranks ahead of a number of comparator countries, including Austria (26 per cent), Australia (26 per cent), Ireland (23 per cent), Denmark (23 per cent), and the U.S. (23 per cent), yet well behind the top-performing countries of Sweden (44 per cent), Norway (44 per cent), and Finland (40 per cent).
Canada ranks 5th out of 14 countries, and receives a “C” grade, for its participation rate of older adults (aged 55–64 years) in non-formal job-related education and training. With only 19 per cent of older adults participating in educational activities, Canada sits well behind the top-performing economies of Sweden and Norway, where over a third of older adults participate in non-formal job-related education and training.
With mandatory retirement no longer in effect in Canada, more and more Canadians are working past the age of 65. Many will require ongoing skills development and retraining. It would serve Canada well to invest more in the ongoing education and skills development of its population.
Footnotes
1 Organisation for Economic Co-operation and Development, Education at a Glance 2012 (Paris: OECD, 2012), 408.
2 Organisation for Economic Co-operation and Development, Education at a Glance 2012 (Paris: OECD, 2012), 416.