
Equity in Learning Outcomes
Key Messages
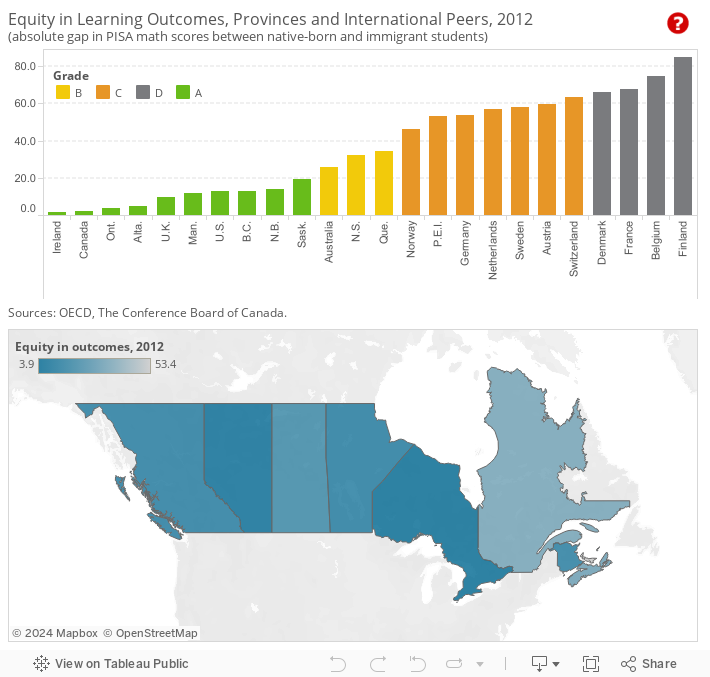
- Six provinces earn “A”s on equity in learning outcomes.
- Countries that emphasize economic immigration (e.g., Canada, U.K., Australia) have a smaller gap in scores between immigrant and native-born students on PISA’s math test.
- In Canada, the language spoken at home by immigrant students does not necessarily affect their scores on the PISA math test.
Putting Canada’s equity in learning outcomes in context
The grand promise of public education is to provide all students with an equal opportunity to learn and prepare themselves for work or future education regardless of their socio-economic background. The Organisation for Economic Co-operation and Development (OECD) notes that “a country’s success in integrating immigrants’ children into society is a key indication of the efficacy of social policy in general and education policy in particular.”1
In an immigrant society like Canada’s, this ambition is critically important in ensuring that immigrant children have life opportunities equal to those of Canadian-born children. Canadian education delivers on this promise, though there is room for improvement.
Equity in learning outcomes is measured by looking at the gap in the math test scores of native-born and immigrant students. The math test used for this report card is from the Programme for International Student Assessment (PISA), an international assessment of the skills and knowledge of 15 year olds, coordinated by the OECD.
How do the provinces rank internationally on equity in learning outcomes?
Six provinces, Ontario, Alberta, Manitoba, British Columbia, New Brunswick, and Saskatchewan, score “A”s. Overall, the provinces rank relatively high on this indicator—with only one province getting a “C.” (Data were not available for Newfoundland and Labrador.) Several European countries perform poorly on this indicator. Denmark, France, Belgium, and Finland are “D” performers, with large gaps in test scores between native-born and immigrant students.
Do immigration policies help explain the gap in performance among countries?
Immigration policies likely have some impact on how countries perform on equity in learning outcomes. The top performers—Australia, the U.K., and Canada—all have points-based immigration systems that emphasize economic immigrants. Many of the immigrant children in these countries have comparatively high-achieving parents who were selected to come to the country based on the expectation that they would make a significant economic contribution. In addition, language skills are a key determinant for eligibility in each of these countries. Parents with knowledge of the host country’s dominant language are also in a better position to help their children integrate into the school system and society in general.
Finland, the country that scores the lowest on equity in learning outcomes, has one of the highest rates of asylum seekers among its immigrant populations. Over the last 10 years, asylum seekers represented 25 per cent of immigrants to Finland.2 In 2011, the major source countries for asylum seekers in Finland were Iraq, Somalia, and Russia.3 Since asylum seekers are migrating to avoid persecution, it is likely that many would not have previously prepared to migrate, nor would they necessarily have had a say in the decision as to where they emigrate. As a result, many refugees do not possess the necessary language skills to enable them to easily adapt and help their children integrate into their new education environment. The difficulty in closing the gap in Finland is compounded by the high performance of the native-born population on the PISA tests. More data is needed to determine whether immigrant children (particularly refugees) do eventually close the gap with the native-born population.
How do the provinces perform relative to each other?
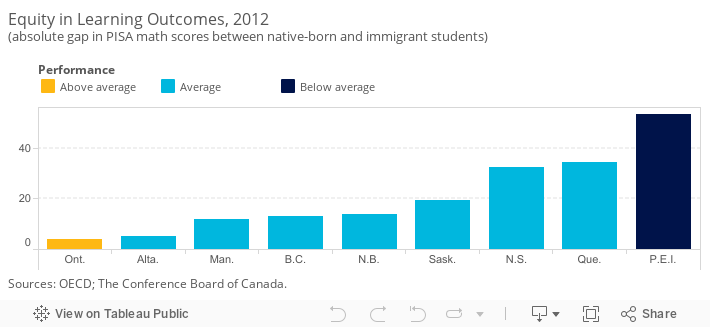
In addition to ranking the provinces against Canada’s international peers, the provinces have been compared with each other and placed into three categories: “above average,” “average,” and “below average.”4
Ontario had the smallest discrepancies on mathematics scores for Canadian-born and immigrant students and is ranked as above average, although Alberta is not far behind. P.E.I. had the largest gap.
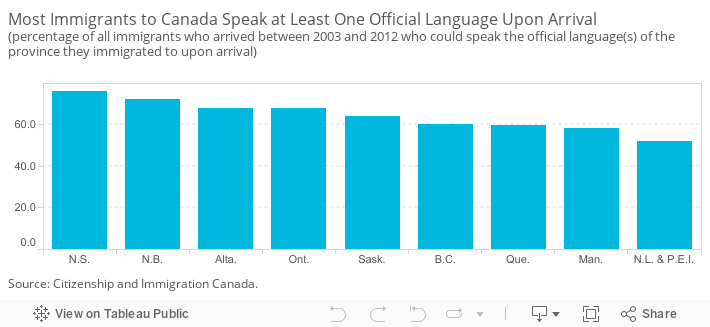
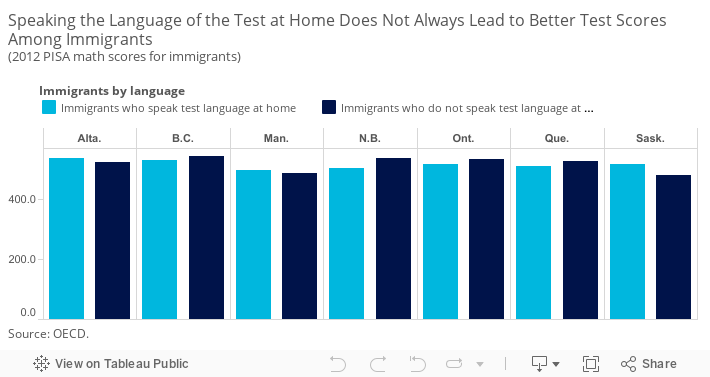
One possible factor that could be influencing the performance of students on this indicator is the number of immigrant students who speak the language of the test at home. The majority of Canadian immigrants do speak one of Canada’s official languages upon arrival.5 However, P.E.I., in combination with Newfoundland and Labrador, has one of the lowest levels of English-language fluency among all immigrants to Canada.
But although one might expect that immigrants who speak the language of the test at home would outperform immigrants who do not, examining the provincial data shows that is not always the case. In only three out of seven provinces where data are available, immigrants who speak the language of the test at home perform better than those who do not. It remains to be seen what would happen to the test results if scores for reading literacy were used as opposed to mathematics. (Math was the area of focus in the 2012 PISA test, so results on reading by immigration status are not available.)
Although language is certainly important, it may be that Canada’s selective immigration policy is having an impact on the performance of immigrant youth. Canada seeks out well-educated individuals who, in turn, may provide a strong foundation for their children’s educational performance, regardless of the language spoken at home. Overall, the relatively small discrepancies between the scores of Canadian-born and immigrant students on PISA’s math test is an indication that the provincial education systems are making a contribution to equity in educational outcomes.
Footnotes
1 OECD, PISA 2012 Results: Excellence Through Equity: Giving Every Student the Chance to Succeed, Volume II (Paris: OECD, 2013), 71.
2 OECD Stat Extracts, International Migration Database. By comparison, in the last 10 years, asylum seekers represented about 3 per cent of immigrants to Australia, 12 per cent to Canada, and 34 per cent to France (also a low performer on this indicator).
3 UNHCR, Asylum Trends 2012 (Geneva: UNHCR, 2013), 24.
4 To compare the performance of Canadian provinces relative to one another, we first determined the average score and standard deviation of the provincial values. The standard deviation is a measure of how much variability there is in a set of numbers. If the numbers are normally distributed (i.e., the distribution is not heavily weighted to one side or another and/or does not have significant outliers), about 68 per cent will fall within one standard deviation above or below the average. Any province scoring one standard deviation above the average is “above average.” Provinces scoring less than the average minus one standard deviation are “below average.” The remaining provinces are “average” performers.
5 Citizenship and Immigration Canada, Facts and Figures 2012 (accessed March 6, 2014).