
Students With High-Level Math Skills
Key Messages
- Only one Canadian province—Quebec—earns an “A” grade on the proportion of students with high-level math skills.
- Five provinces earn “D” or “D–” grades.
- The proportion of students with high-level math skills decreased in all provinces between 2003 and 2012, putting many students at greater risk of having difficulty later in life.
Putting student math skills in context
The Programme for International Student Assessment (PISA) is an international assessment of the skills and knowledge of 15 year olds, coordinated by the Organisation for Economic Co-operation and Development (OECD). It assesses whether students approaching the end of compulsory education have acquired the skills that are essential for full participation in modern society, particularly in mathematics, reading, and science.1 There have been four comparable PISA assessments of math skills—in 2003, 2006, 2009, and 2012.
PISA defines math literacy as:
an individual’s capacity to formulate, employ, and interpret mathematics in a variety of contexts. It includes reasoning mathematically and using mathematical concepts, procedures, facts and tools to describe, explain and predict phenomena. It assists individuals to recognise the role that mathematics plays in the world and to make the well-founded judgments and decisions needed by constructive, engaged and reflective citizens.2
In its report on the 2012 PISA results, the OECD outlines the importance of math skills in today’s world:
An understanding of mathematics is central to a young person’s preparedness for life in modern society. A growing proportion of problems and situations encountered in daily life, including in professional contexts, require some level of understanding of mathematics, mathematical reasoning and mathematical tools, before they can be fully understood and addressed. Mathematics is a critical tool for young people as they confront issues and challenges in personal, occupational, societal, and scientific aspects of their lives.3
The importance of mathematical literacy was highlighted in a July 2013 press release from Canada’s Council of Ministers of Education, which stated that “numeracy was a key priority and that provinces and territories would work together to identify and share best practices on innovative teaching and learning strategies to raise student achievement in this area.”4
What are high-level math skills?
PISA math skills are measured on a continuum, with level 6 the highest and level 1 the lowest. The Conference Board regards students as having high-level math skills if they test at level 5 or above on the PISA math test. At level 5, students can:
develop and work with models for complex situations, identifying constraints and specifying assumptions. They can select, compare, and evaluate appropriate problem-solving strategies for dealing with complex problems related to these models. Students at this level can work strategically using broad, well-developed thinking and reasoning skills, appropriate linked representations, symbolic and formal characterisations, and insight pertaining to these situations. They can reflect on their actions and formulate and communicate their interpretations and reasoning.5
How do the provinces rank relative to Canada’s international peers?
Taken as a whole, Canada performs reasonably well compared with international peers. With 16.4 per cent of Canadian 15 year olds scoring at level 5 or higher on PISA’s math test, Canada achieves a grade of “B” and lags five international peers—Japan, Switzerland, Belgium, the Netherlands, and Germany.
At a provincial level, however, only three of ten provinces achieve grades of either “A” or “B” relative to international comparator countries, while two (Ontario and Saskatchewan) earn “C”s, and five earn “D” grades.6
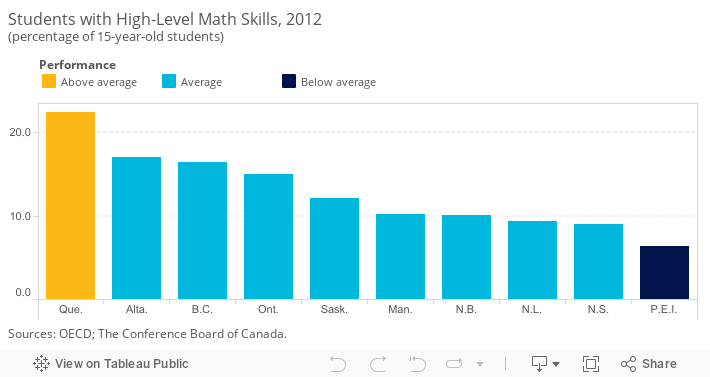
Quebec (22.4 per cent), Alberta (17 per cent), and British Columbia (16.5 per cent) have higher proportions of students with high-level math skills than Canada as a whole (16.4 per cent) and earn grades of “A,” “B,” and “B,” respectively. With 15 per cent of its students achieving high-level math results, Ontario is not too far behind the Canadian average, but nevertheless earns only a “C” relative to international peers.
By contrast, only 9.4 per cent of students in Newfoundland and Labrador and 9 per cent in Nova Scotia have high-level math skills, earning each province a “D” grade. Internationally, these provinces are in the company of Norway (9.4 per cent), the U.S. (8.8 per cent), and Sweden (8 per cent)—all of which earn “D”s. P.E.I. gets a “D–” for having a smaller share in students with high-level math skills than the worse-performing international peer country.
How do the provinces perform relative to each other?
In addition to ranking the provinces against Canada’s international peers, the provinces have been compared with each other and placed into three categories: “above average,” “average,” and “below average.”7
There are marked variations among provinces. Quebec, where almost one in four students performed at a high level in math, is the only province to be considered above average. Prince Edward Island, with fewer than 1 in 10 with high-level skills, is the sole below-average performer.
How have provincial high-level math skills changed over time?
Between 2003 and 2012, the proportion of Canadian students with high-level math skills decreased in every province, in some cases dramatically. For example, although Alberta only dropped from an “A” to a “B” relative to international peer countries, the proportion of students with high-level math in that province slipped by 10 percentage points, from 27 per cent in 2003 to 17 per cent in 2012. Manitoba had a similarly precipitous decline, from 19 per cent in 2003 to 10.2 per cent by 2012, falling two letter grades, from “B” to “D” relative to international comparators.
Quebec had the smallest decline in high-level math—falling from 23.6 to 22.4 per cent between 2003 and 2012. Given that international performance also slipped further, Quebec managed to maintain its “A” grade. Four other provinces also managed to hold onto the same grade, while five got lower grades than they did in 2003.
Is there a difference in the math performance of boys and girls?
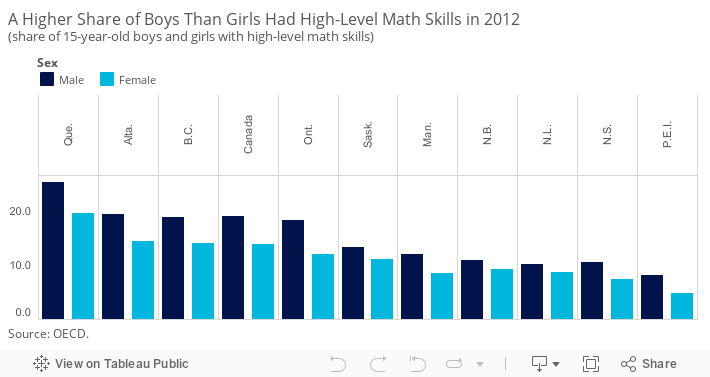
In all provinces, more boys than girls achieve the highest levels (levels 5 and 6) on the PISA math test. In Quebec, the top-performing province on this indicator, over 26 per cent of boys and 19.5 per cent of girls have high-level math skills. The worst performer for both girls and boys is Prince Edward Island. The largest gender gap is in Ontario, where there is a 6.2 percentage point difference between the share of boys (18.2 per cent) and girls (12 per cent) with high-level math skills.
Why do girls perform worse in math? The OECD notes:
girls’ perceptions of themselves as learners of mathematics determine how well they motivate themselves and persevere in the face of difficulties when learning mathematics. Many girls choose not to pursue careers in science, technology, engineering and mathematics because they do not have the confidence in their ability to excel in mathematics, despite having the capacity and skills to do so.8
Do PISA math performance results predict future educational success?
Results from the Youth in Transition Survey, by Statistics Canada, show a positive relationship between the math skills of 15-year-old students and the likelihood of completing further education. The effects of improving math skills are “in most cases statistically significant and also quantitatively important.”9
There were, however, gender differences. For girls, the effect of improving math skills had a stronger positive effect on high-school completion. For boys, the effect was strong on completing some post-secondary education.10
An outstanding issue is whether good results on the PISA math tests set students on a path to pursue advanced credentials in related fields. Over time, we might expect to see a relationship between these scores and the number of graduates in science, math, computer science, and engineering.
Footnotes
1 OECD, PISA 2012 Assessment and Analytical Framework: Mathematics, Reading, Science, Problem Solving, and Financial Literacy (Paris: OECD, 2013), 25.
2 Ibid., 23.
3 Ibid., 24.
4 Council of the Ministers of Education, Canada. “Ministers Call for More Innovation and Expanded Opportunities as Education Systems Look to the Future.” Press Release, July 5, 2013.
5 Statistics Canada, Mathematics Proficiency Levels (accessed March 3, 2014).
6 No data were collected in the three territories and in First Nations schools.
7 To compare the performance of Canadian provinces relative to one another, we first determined the average score and standard deviation of the provincial values. The standard deviation is a measure of how much variability there is in a set of numbers. If the numbers are normally distributed (i.e., the distribution is not heavily weighted to one side or another and/or does not have significant outliers), about 68 per cent will fall within one standard deviation above or below the average. Any province scoring one standard deviation above the average is “above average.” Provinces scoring less than the average minus one standard deviation are “below average.” The remaining provinces are “average” performers.
8 OECD, Are Boys and Girls Equally Prepared for Life? (OECD: Paris, 2014), 1.
9 OECD, Pathways to Success: How Knowledge and Skills at Age 15 Shape Future Lives in Canada (Paris: OECD, 2010), 67.
10 Ibid.