
Students With High-Level Science Skills
Key Messages
- Two provinces—Alberta and British Columbia—earn “A” grades for having a high proportion of students with high-level science skills.
- Five provinces get “D”s, while P.E.I. earns a “D–″ grade.
- Between 2006 and 2012, the proportion of students with high-level science skills decreased in all provinces except Alberta, with three provinces falling from “B” to “D.”
Putting student science skills in context
The growing role of science, math, and technology in everyday life means science skills are important for all students, not just those aspiring to a career in the sciences. This is a significant shift from the past, when school curricula were dominated by the need to provide the foundations for the professional training of a small number of mathematicians, scientists, and engineers.1
The Programme for International Student Assessment (PISA) is an international assessment of the skills and knowledge of 15 year olds, coordinated by the Organisation for Economic Co-operation and Development (OECD). It assesses whether students approaching the end of compulsory education have acquired the skills that are essential for full participation in modern society, particularly in mathematics, reading, and science.2 There have been three comparable PISA assessments of science skills—in 2006, 2009, and 2012.
The OECD notes that “an understanding of science and technology is central to a young person’s preparedness for life in modern society, not least because it empowers individuals to participate in determining public policy where issues of science and technology affect their lives.”3
PISA defines science literacy as:
an individual’s scientific knowledge and use of that knowledge to identify questions, to acquire new knowledge, to explain scientific phenomena, and to draw evidence-based conclusions about science-related issues, understanding of the characteristic features of science as a form of human knowledge and enquiry, awareness of how science and technology shape our material, intellectual and cultural environments, and willingness to engage in science-related issues, and with the ideas of science, as a reflective citizen.4
Basic competencies in science are generally considered essential to be able to use new technology, while high-level competencies are critical for the creation of new technology and innovation. This makes the acquisition of science skills through the core education system integral to a country’s ability to be successful in the new knowledge economy.
What are high-level science skills?
PISA science skills are measured on a continuum, with level 6 the highest and level 1 the lowest. The Conference Board regards students as having high-level science skills if they test at level 5 or above. Students performing at level 5 can:
identify the scientific components of many complex life situations, apply both scientific concepts and knowledge about science to these situations, and can compare, select and evaluate appropriate scientific evidence for responding to life situations. Students at this level can use well-developed inquiry abilities, link knowledge appropriately and bring critical insights to situations. They can construct explanations based on evidence and arguments based on their critical analysis.5
How do the provinces rank relative to Canada’s international peers?
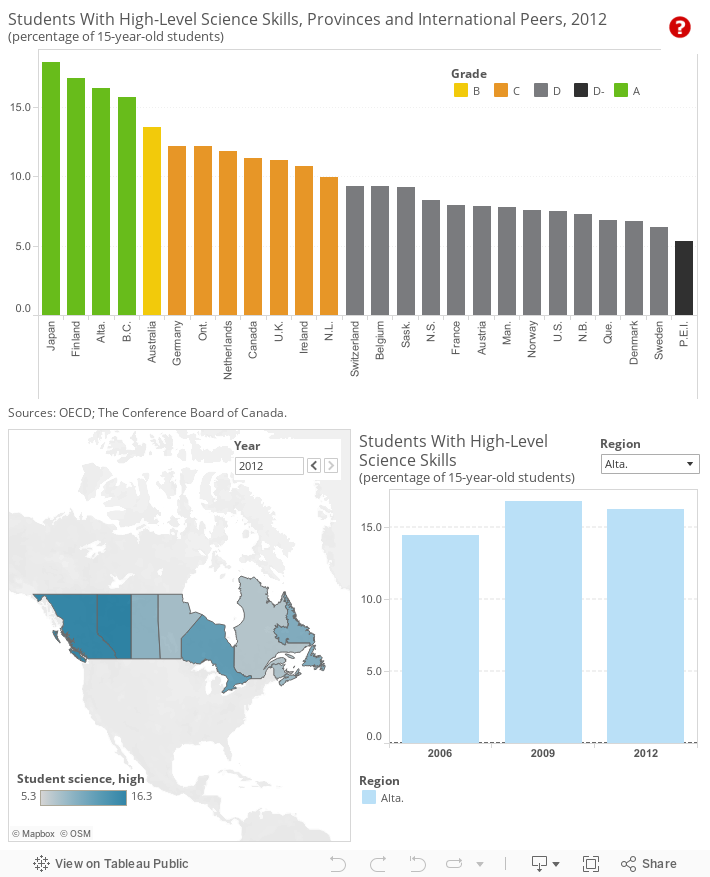
Taken as a whole, Canada ranks sixth among international peers but because the performance of leading countries is so strong, Canada manages to earn only a “C” grade. With just 11.3 per cent of Canadian 15 year olds scoring at level 5 or higher on PISA’s science test, Canada lags Japan (18.2 per cent) and Finland (17.1 per cent) by considerable margins, and also trails Australia, Germany, and the Netherlands.
At a provincial level, two provinces do very well.6 With 16.3 per cent of Alberta’s students and 15.7 of B.C.’s students scoring at level 5 or higher on the PISA science test, these provinces earn “A” grades. Although a higher proportion of Ontario’s students (12.2 per cent) have high-level science skills than Canadian students as a whole (11.3 per cent), that province earns only a “C” grade in the face of strong performance by some international comparator countries.
Five provinces achieve grades of “D” relative to international comparator countries. Only 7.3 per cent of students in New Brunswick and 6.8 per cent in Quebec have high-level science skills. Internationally, these provinces are in the company of the U.S. (7.5 per cent), Denmark (6.8 per cent), and Sweden (6.3 per cent)—all of which earn “D” grades.
Only 5.3 per cent of students in Prince Edward Island have high-level science skills, placing that province last among provincial and international jurisdictions. Because the province scores lower than any international peer, P.E.I. receives a “D–” grade.
How do the provinces perform relative to each other?
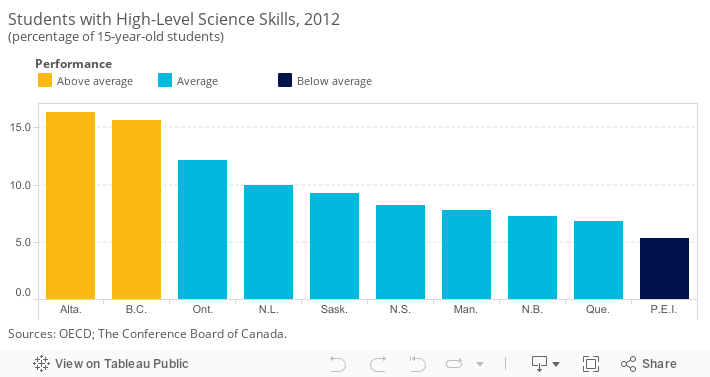
In addition to ranking the provinces against Canada’s international peers, the provinces have been compared with each other and placed into three categories: “above average,” “average,” and “below average.”7
There is significant variation across the country. Alberta and B.C. are above-average performers, while P.E.I. is the sole below-average province.
How have provincial high-level science skills changed over time?
Between 2006 and 2012, the proportion of Canadian students with high-level science skills decreased in nine of ten provinces. The lone exception was Alberta, where the proportion of students with high-level science skills increased from 14.5 per cent in 2006 to 16.3 per cent in 2012, moving the province from a grade of “B” to an “A” relative to international peer countries. Although B.C. managed to retain an “A” grade, the proportion of students with high-level science in that province fell from 18.4 per cent in 2006 to 13.0 per cent in 2009, before recovering slightly to 15.7 per cent in 2012.
The decline in high-level science skills has been dramatic in some provinces. Three provinces—Nova Scotia, Quebec, and Manitoba—went from grades of “B” to “D” relative to international comparators between 2006 and 2012. Meanwhile, the proportion of students with high-level science fell from 14.4 to 8.2 per cent in Nova Scotia, from 14.4 to 6.8 per cent in Quebec, and 13.5 to 7.7 per cent in Manitoba.
Internationally, many countries also suffered declines in performance between 2006 and 2012, though in most cases by no more than one or two percentage points. The exception to this was Finland, which dropped nearly 4 percentage points. But because Finland’s performance in 2006 was well ahead of other countries (20.9 per cent), the decline still left the country with a 2012 score of 17.1 per cent—enough to retain an “A” grade.
A few countries managed to improve performance, including Japan (from 15.1 to 18.2 per cent) and Ireland (9.4 to 10.75 per cent). Given the generally good performance of international comparator countries between 2006 and 2012, the declining performance of most Canadian provinces creates a substantial performance gap.
Is there a difference in the science performance of boys and girls?
While a breakdown of the results into six proficiency levels is not available at the provincial level by gender, we can compare the differences in the average scores of boys and girls on the PISA science test. In Canada, and across all provinces, no statistically significant gender differences were observed between boys and girls in the science test.8
How important are high-level science skills?
Science skills and scientific literacy are essential in our advanced economy and society. Although not all citizens require advanced science skills, having a high proportion of people with high-level science skills gives a country or province a strong foundation for research that can contribute to economic, social, and individual well-being. Moreover, when citizens who do not work in the sciences directly have higher-level science skills, a country or province is better positioned to adopt evidence-based policies and practices. As the OECD observes:
Scientific literacy matters at both the national and international level as humanity faces major challenges in providing sufficient water and food, controlling diseases, generating sufficient energy and adapting to climate change. Many of these issues arise, however, at the local level where individuals may be faced with decisions about practices that affect their own health and food supplies, the appropriate use of materials and new technologies, and decisions about energy use. Dealing with all of these challenges will require a major contribution from science and technology. Yet, as argued by the European Commission, the solutions to political and ethical dilemmas involving science and technology “cannot be the subject of informed debate unless young people possess certain scientific awareness.”9
Footnotes
1 OECD, Learning for Tomorrow’s World: First Results From PISA 2003 (Paris: OECD, 2004), 37.
2 OECD, PISA 2012 Assessment and Analytical Framework: Mathematics, Reading, Science, Problem Solving, and Financial Literacy (Paris: OECD, 2013), 25.
3 Ibid., 98.
4 Ibid.
5 Ibid., 17.
6 No data were collected in the three territories and in First Nations schools.
7 To compare the performance of Canadian provinces relative to one another, we first determined the average score and standard deviation of the provincial values. The standard deviation is a measure of how much variability there is in a set of numbers. If the numbers are normally distributed (i.e., the distribution is not heavily weighted to one side or another and/or does not have significant outliers), about 68 per cent will fall within one standard deviation above or below the average. Any province scoring one standard deviation above the average is “above average.” Provinces scoring less than the average minus one standard deviation are “below average.” The remaining provinces are “average” performers.
8 Pierre Brochu, Marie-Anne Deussing, Koffi Houme, and Maria Chuy, Measuring Up: Canadian Results of the OECD PISA Study (Toronto: Council of Ministers of Education, Canada, 2013), 40.
9 OECD, PISA 2015 Draft Science Framework (Paris: OECD, March 2013), 3.