
Return on Investment in Tertiary Education
- Canada ranks 10th out of 15 peer countries and gets a “C” on the private and public payoff for men with a tertiary education; Canada ranks 9th and gets a “B” on the payoff for women.
- The relative earnings of adult Canadians increase with educational attainment—although the earnings premium has diminished slightly over the past decade.
- Men generally benefit more from investments in education than women.
Putting Canada’s performance on the return on investment in tertiary education in context
Investing in education has its benefits. In most countries, individuals who graduate from college or university (tertiary education) tend to benefit from better labour market prospects, reduced risk of unemployment, and higher earnings over the course of their working lives. Public returns include a mix of social and economic benefits, including additional revenues earned through taxes, lower social transfers, and reduced public spending on social welfare programs.1 Building an educated workforce benefits not only the current economy but also future generations of individuals, by contributing to a more innovative, competitive, and productive workforce.
Does it pay to get a college or university education in Canada?
The net present value of investing in tertiary in Canada is positive. The total return (net present value), both private and public, for a Canadian man who completes tertiary education is $220,365 ($153,520 in benefits to the individual and $66,845 to society). And for a Canadian women, the total return is $158,036 ($111,487 to the individual and $46,539 to society). These significant positive returns—both for individuals and the country—demonstrate the value that Canadians and the Canadian economy place on educational achievement.
How is the return on investment in tertiary education calculated?
The total return on investment in tertiary education is calculated by first adding the net private returns and the net public returns, and then calculating the net present value of this total.
Net private returns = private benefits (e.g., higher earnings, lower risk of unemployment) – private costs (e.g., tuition and books, forgone earnings)
Net public returns = public benefits (e.g., higher tax revenues, reduced social transfers) – public costs (e.g., forgone taxes on earnings, increased spending on education)
The net present value of the total returns is calculated by discounting back in time using a real discount rate of 3 per cent. This ensures that all calculations reflect constant prices.
The dollar values used for this report card are based on the difference between people who have a tertiary education and those who have a high school education (upper secondary) or a certificate or diploma from a vocational school or apprenticeship training (post-secondary non-tertiary education).
How does Canada’s return on investment in tertiary education compare to those of its peers?
When comparing Canada’s overall return on investing in tertiary investments with its peer countries, Canada’s performance is middle-of-the-pack at best. Many other countries (and the individuals in those countries) get much better returns on their tertiary investments.
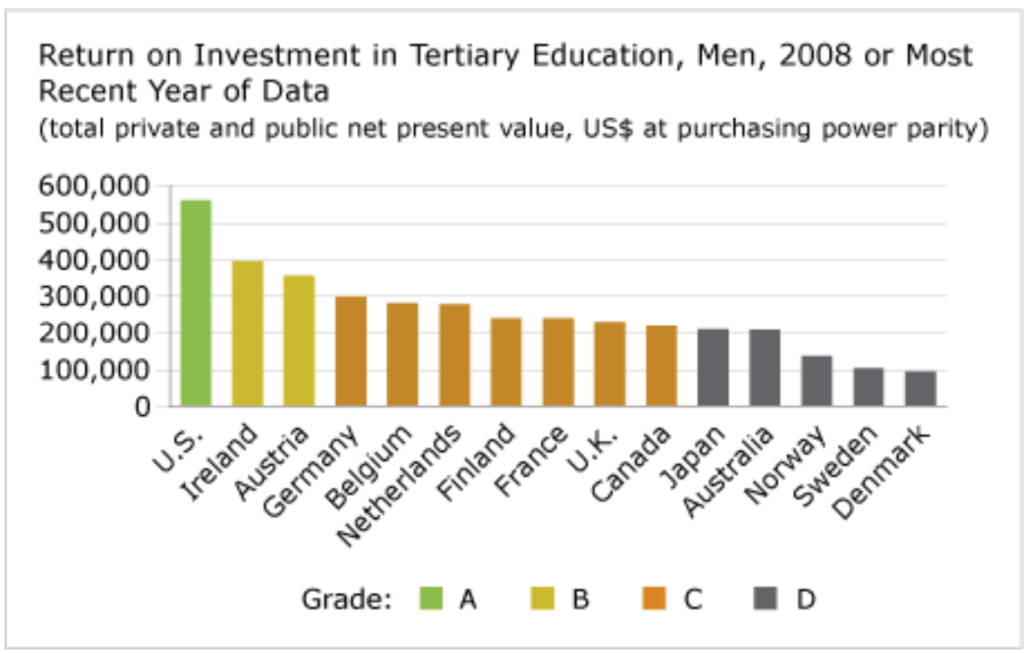
Canada ranks 10th out of 15 countries and gets a “C” on the total private and public return for men with a tertiary education. Canada places ahead of the “D” performers: Japan (10th: $210,428), Australia (11th: $208,523), Norway (12th: $137,394), Sweden (13th: $104,137), and Denmark (14th: $94,790). But Canada places well back of the U.S. (1st: $562,331)—a solid “A”—as well as Ireland (2nd: $396,422) and Austria (3rd: $357,151)—both “B” performers.
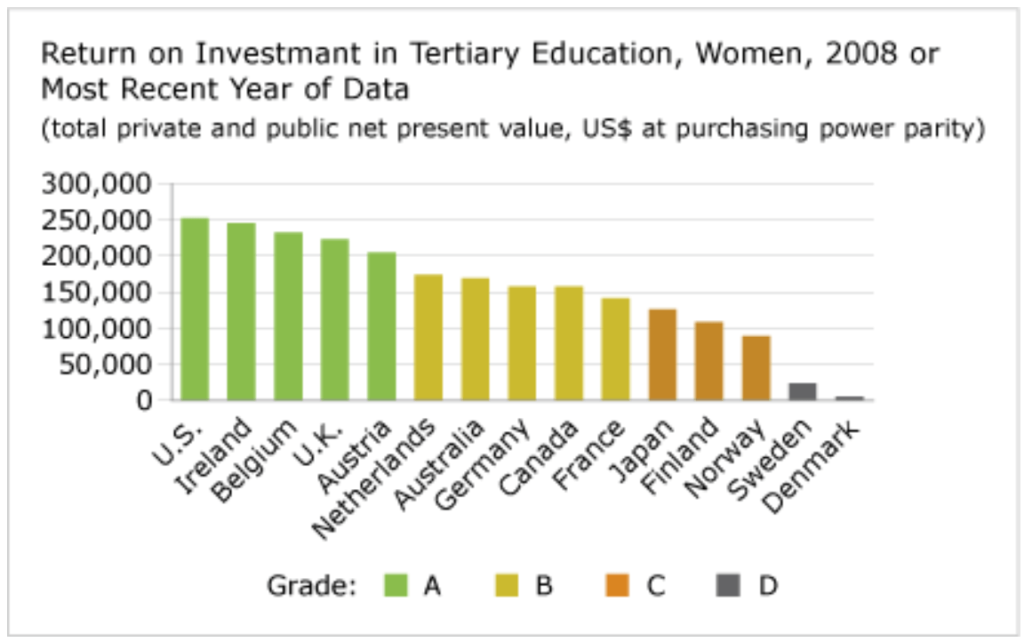
Canada ranks 9th out of 15 countries and gets a “B” on the net private and public return for women with a tertiary education. Canada ranks ahead of 6 peer countries, including France (11th: $141,341), Japan (12th: $126,226), and Finland (13th: $108,344). But Canada is behind the front-runners, including the U.S. (1st: $252,577), Ireland (2nd: $245,785), Belgium (3rd: $232,151), and the U.K. (4th: $223,409)—all “A” performers.
Does the return on investment in tertiary education vary by gender?
In most countries, men generally benefit more than women from investments in education. This is certainly the case among the 16 peer countries graded for this report card, including Canada. Canadian men receive, on average, a $62,339 premium over their female counterparts for tertiary achievements.
The size of the differences between men’s and women’s earnings varies considerably among peer countries. In the U.S., for example, men realize a $565,331 return on their tertiary investments (1st among 16 comparator countries), while U.S. women realize a $252,577 return (1st among 16 countries). The earnings gap between U.S. men and women is $309,754, significantly more than the tertiary earnings gap between men and women in peer countries such as Canada ($62,339), Ireland ($150,637), Austria ($152,004), and Germany ($142,572).
This gender imbalance occurs in all peer countries—with men benefiting more than women from tertiary education—and is linked to many different variables (some individual, others societal), including the choices individuals make around major fields of study (for example, arts, humanities, business, math, or engineering) and what programs are offered at colleges and universities; occupational choices; wage differences across major fields of study and occupations; labour force status; gender, diversity, and equity issues; and even a country’s broader social and economic policies.
What are the earnings differences between different levels of education?
In all 16 peer countries, individuals with either a college or university education earn more than those with lower educational achievement.
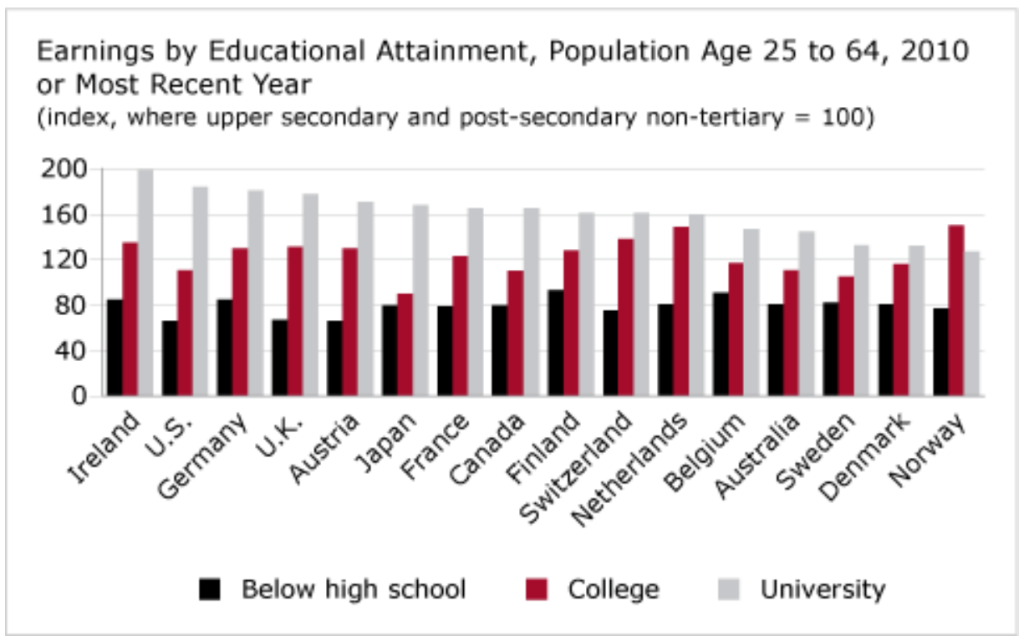
Using a base of 100 to represent the earnings of individuals with either upper secondary (high school) or post-secondary non-tertiary achievement (a certificate or diploma from vocational school or apprenticeship training), the chart shows that as education increases so too do earnings. Among peer countries, the differences in earnings between individuals without a high school diploma and those with a tertiary diploma or degree are most pronounced in the U.S., Ireland, and the United Kingdom.
Canadians with less than high school earn 80 per cent of what individuals with high school or some post-secondary non-tertiary education earn. In Finland, individuals with the same level of education (e.g., below high school) earn 93 per cent of what individuals with upper secondary and post-secondary non-tertiary education—the highest level of earnings for this level of education. And individuals in the U.S. without a high school diploma earn just 66 per cent of what individuals with one might earn.
Canadians who complete college can expect to earn quite a bit more—44 per cent more—than Canadians without a high school diploma; and Canadian university graduates can expect to earn even more—85 per cent more—than individuals without a high school diploma. The story is most pronounced in Ireland, where a person with a university degree can expect to earn more than double (115 per cent more) what an individual with without a high school diploma can earn.
The OECD notes that on average and across all OECD countries:
- Individuals who invest in upper secondary or post-secondary non-tertiary education can expect a net gain in income over their working lives. For men, this gain in income over individuals who do not have a similar level of education is more than US$90,000; for women, the gain in income is US$67,000.2 In Canada, men who invest in upper secondary or post-secondary non-tertiary education can expect a net gain in income of US$115,292 (well above the OECD average); and for women, the net gain in income is US$68,287 (just above the OECD average).3
- Individuals with a tertiary education can also expect a net gain in income over their working lives. For men, this gain in income is US$162,000; for women, it’s US$110,000.4 Canadian figures are well above the OECD average. Canadian men who invest in tertiary education can expect a net gain in income of US$220,365 over their working lives, and women can expect a net gain in income of US$158,386.5
Of course, investing in upper secondary, post-secondary non-tertiary, and tertiary education is only one part of the story. Education systems, governments, educators and administrators, and others need to ensure that the quality of education provided and the types of learning programs offered are relevant, meaningful, and valued in order for individuals to contribute to the economic and social well-being of their communities and countries. This requires, among other things:
- ongoing and open dialogue between education, government, and industry
- effective school-to-work transitions
- an awareness and understanding of economic trends and labour market issues (supply and demand) within a country
Have the earnings premiums for university education gone up or down over the past decade?
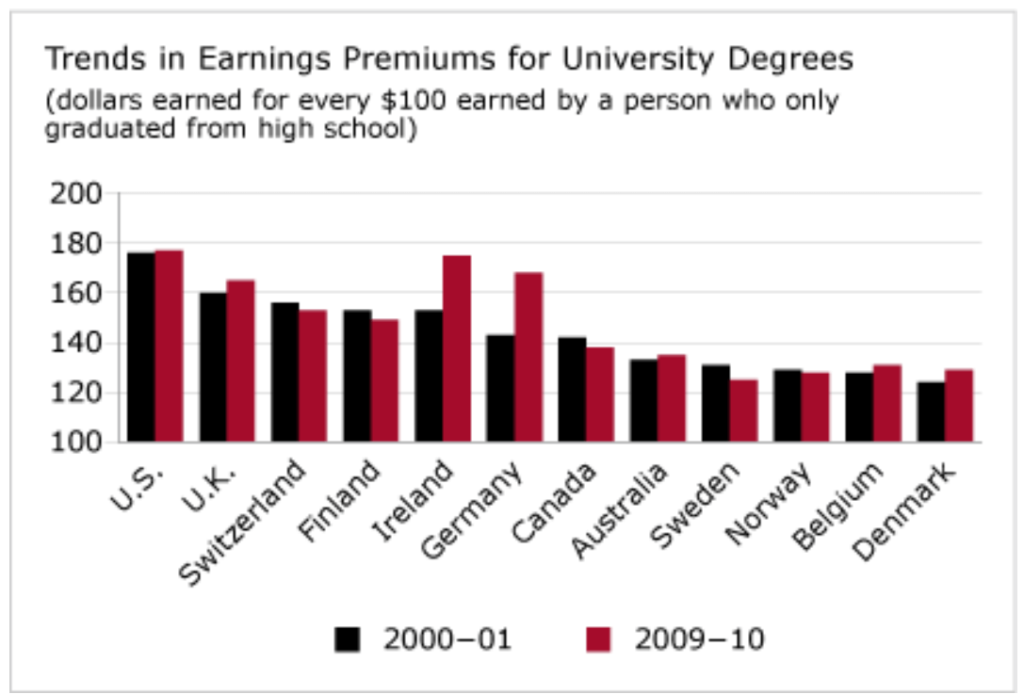
The earnings premiums for university degrees increased in seven of the 12 peer countries for which data are available: Germany ($143 to $168), Ireland ($153 to $175), the U.K. ($160 to $165), Denmark ($124 to $129), Belgium ($128 to $131), Australia ($133 to $135), and the U.S. ($176 to $177). Germany and Ireland had the largest increases—up $25 and $22, respectively.
In Canada, earnings premiums for university degrees have fallen from $142 to $138 for every $100 earned by a person who has a high school diploma. Other countries that saw a drop in earnings premiums are Sweden ($131 to $125), Finland ($153 to $149), Switzerland ($156 to $153), and Norway ($129 to $128). Sweden had the largest decrease, dropping $6.
Which countries perform the best on the indicator measuring the return on investment in tertiary education?
The return on investment in tertiary education is the best in the U.S., Ireland, and Austria. Individuals who have completed tertiary education in these countries tend to enjoy better labour market prospects, higher gross earnings over the course of their working lives, and reduced risks of unemployment (whether in absolute terms or duration). Tertiary education is often seen as the springboard to numerous social and economic benefits.
Economies that invest in the education and skills development of their populations—through post-secondary education systems and other avenues—also stand to benefit in terms of higher tax revenues and fewer social transfer costs.
Footnotes
1 Organisation for Economic Co-operation and Development, Education at a Glance 2012 (Paris: OECD, 2012), 163–165.
2 Organisation for Economic Co-operation and Development, Education at a Glance 2012 (Paris: OECD, 2012), 164–165.
3 Organisation for Economic Co-operation and Development, Education at a Glance 2012 (Paris: OECD, 2012), 174–181.
4 Organisation for Economic Co-operation and Development, Education at a Glance 2012 (Paris: OECD, 2012), 164–165.
5 Organisation for Economic Co-operation and Development, Education at a Glance 2012 (Paris: OECD, 2012), 174–181.