
Performance of Disadvantaged Schools
Key Messages
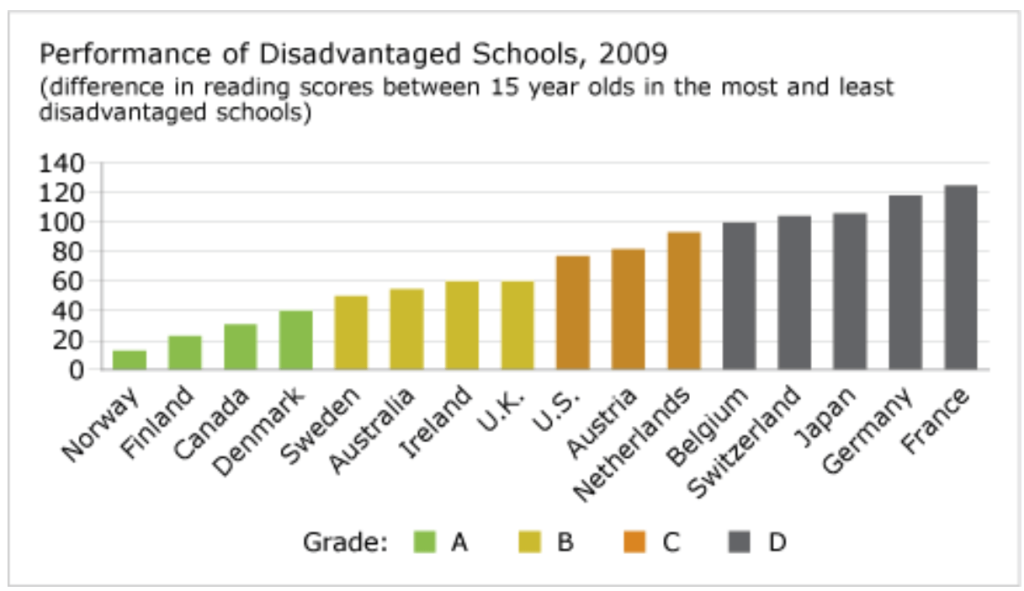
- Canada gets an “A” and ranks 3rd out of 16 peer countries in the difference in reading test scores between 15-year-old students in the most and least disadvantaged schools.
- On average in all OECD countries, students from the most disadvantaged schools are two years behind students from the least disadvantaged schools in their reading levels.
- Canada places well above the OECD average, and six spots ahead of the United States.
Putting Canada’s performance of disadvantaged schools in context
The OECD notes that “equity in education means that personal or social circumstances, such as gender, ethnic origin or family background, are not obstacles to achieving educational potential (fairness) and that all individuals reach at least a basic minimum level of skills (inclusion).”1 One way to measure the overall quality and equity of a country’s learning initiatives is to examine the differences in learning outcomes between students from the most and least disadvantaged schools. Countries with smaller learning outcomes gaps are considered to have more equitable and efficient learning systems.
The reading test used for this report card is from the Programme for International Student Assessment (PISA), an international assessment of the skills and knowledge of 15 year olds, coordinated by the OECD.
How does the OECD define disadvantaged schools?
Disadvantaged schools are defined as schools in which the average socio-economic background of students is below the national average.2 One measure used by the OECD to estimate socio-economic background of a school’s student body is to look at the proportion of students with low-educated mothers (e.g., mothers without a high school education) and high-educated mothers (e.g., mothers with tertiary education). Schools with a high proportion of students with low-educated mothers are considered to be disadvantaged.
How serious is the issue of the gap in outcomes of disadvantage schools?
Across all OECD countries, there is a gap between the reading scores of students attending the most disadvantaged schools and those of students at the least disadvantaged schools. On average, students at the most disadvantaged schools score well below students at the least disadvantaged schools—the difference in PISA reading scores between the most and least disadvantaged schools is 77 points, the equivalent of nearly two school years. That is to say, on average in all OECD countries, students from the most disadvantaged schools are two years behind students from the least disadvantaged schools in their reading levels.3
This significant gap is of concern given that the most disadvantaged schools tend to have higher proportions of disadvantaged students, which in turn reinforces and amplifies socio-economic inequalities and injustices surrounding these schools, including higher levels of unemployment, poorer neighbourhoods, higher proportions of single-parent families, more health problems, higher crime rates, and the exodus of good teachers and top-performing students. All of this can contribute to lower educational achievement in students by inhibiting learning and learning outcomes.4
How does Canada’s performance of disadvantaged schools compare to those of its peer countries?
Canada scores well above the OECD average, with an “A” grade that suggests its secondary education system provides individuals with equal opportunities to learn—regardless of their socio-economic background.
Among the group of 16 peer countries, Canada ranks 3rd and gets an “A.” Canada ranks higher than all comparator countries except Norway (1st) and Finland (2nd), the two countries with the smallest range in PISA reading scores between their most disadvantaged and advantaged schools—with 13 points and 23 points, respectively.
The difference in PISA reading scores between the most and least disadvantaged schools in Canada is 31 points—the equivalent of about 10.3 months of learning. In comparison, the difference in reading scores between students in the most and least disadvantaged schools in Germany (15th) and France (16th) are significantly higher (118 and 125 points, respectively), setting some students back the equivalent of nearly three school years. The U.S. ranks 9th out of 16 countries, with a difference in reading scores between students in its most and least disadvantaged schools of 77 points, equal to the OECD average.5
Which countries perform the best on the indicator measuring the performance of disadvantaged schools?
Norway and Finland are the top performers when it comes to the differences in reading scores between students in the most and least disadvantaged schools. The difference in reading scores between Norway’s most and least disadvantaged schools is just 13 points, and in Finland the difference is 23 points. This is indicative of relatively strong and equitable social policies—many of which go beyond the education system and touch on elements such as housing, income, and health.
When it comes to education, quality and equity should go hand in hand. The OECD notes that “investing in high quality schooling and equal opportunities for all from the early years to at least the end of upper secondary is the most profitable educational policy.”6
Canada needs to continue to invest in and provide meaningful and enriching school experiences for all of its citizens—regardless of their age, gender, ethnicity, or socio-economic background. Reducing the learning outcome gaps between advantaged and disadvantaged schools is a good way to strengthen individual and societal capacities in order to “respond to recession and contribute to economic growth and social well-being.”7
Footnotes
1 Organisation for Economic Co-operation and Development, Equity and Quality in Education: Supporting Disadvantaged Students and Schools (Paris: OECD, 2012), 9.
2 Organisation for Economic Co-operation and Development, Equity and Quality in Education: Supporting Disadvantaged Students and Schools (Paris: OECD, 2012), 148.
3 Organisation for Economic Co-operation and Development, Education at a Glance 2012 (Paris: OECD, 2012), 94.
4 Organisation for Economic Co-operation and Development, Equity and Quality in Education: Supporting Disadvantaged Students and Schools (Paris: OECD, 2012), 107–109. For further reading, see Ruth Lupton, “Schools in Disadvantaged Areas: Recognising Context and Raising Quality,” Paper No. 76 (London. Centre for Analysis of Social Exclusion, School of Economics, 2004).
5 Organisation for Economic Co-operation and Development, Education at a Glance 2012 (Paris: OECD, 2012), 100.
6 Organisation for Economic Co-operation and Development, Equity and Quality in Education: Supporting Disadvantaged Students and Schools (Paris: OECD, 2012), 3.
7 Organisation for Economic Co-operation and Development, Equity and Quality in Education: Supporting Disadvantaged Students and Schools (Paris: OECD, 2012), 3.