
Water Withdrawals
Key Messages
- Canada ranks 15th out of 16 peer countries and earns a “C” grade.
- Canada’s water withdrawals are nearly double that of the 16-country average. Industry is Canada’s largest water user.
- Excessive water withdrawals in Canada can be attributed to the lack of widespread water conservation practices and water pricing that does not promote efficiency
Putting water consumption in context
Canadians must start paying more for water and embrace water conservation measures or risk the depletion of one of Canada’s most valuable resources. More than 15 years ago, Environment Canada first warned that without substantially increasing the price of water consumption, delivery infrastructure was at risk of deteriorating beyond usability.
Several studies show that water revenues are not sufficient to cover operational, repair, upgrading, or expansion costs. They cover only a small part of the costs of supplying water. For example, irrigation water charges recover only about 10 per cent of the development cost of the resource. The cost of maintaining (repairing and upgrading) municipal water supply and sewage systems is estimated at $23 billion over the next 10 years. The fact that this money is not currently available is further evidence that water revenues do not cover costs.1
Increasing the cost of water is one of the best incentives for conservation. Canadians subject to water metering use less water than their rural counterparts who have no means of accounting for their water usage. Furthermore, in Europe, where the price of water has increased, water withdrawals have simultaneously decreased. Canada, which sits at the bottom of the ranking among its peer countries, must seriously contemplate its status as a water-waster if it is to sustain its most valuable resource and the infrastructure critical to its delivery.
How does Canada’s water withdrawals compare to that of other countries?
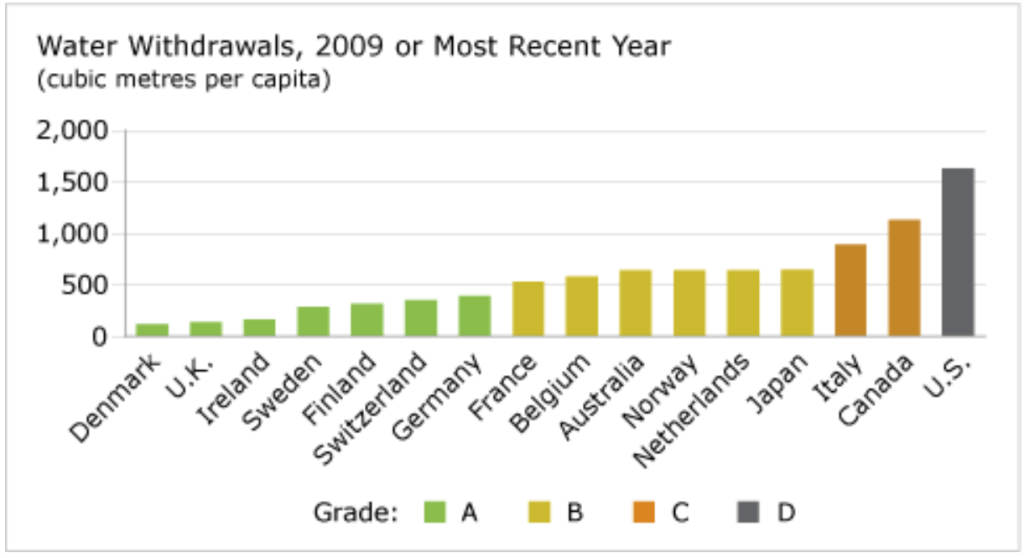
Canada’s freshwater withdrawals were 1,131 cubic metres per capita in 2007—over nine times more than in Denmark, the best performer, and double the 16-country average. Canada ranks second to last on this indicator and earns a “C” grade. Only the U.S. has higher water withdrawals—1,632 cubic metres per capita.
Eight of Canada’s peer countries had freshwater withdrawals below the average of 572 cubic metres per capita; seven of those countries received “A” grades.
Why does Canada waste so much water?
Industry is Canada’s largest water user, using 30.6 billion cubic metres in 2009 to cool machinery and equipment, produce energy, clean goods for manufactured items, and act as a solvent.2 Of the industrial water users, thermal-electric power producers withdraw 86 per cent. Manufacturers take 12.4 per cent—where water is mainly used in paper industries, primary metals industry, and chemicals industries. Mining industries are responsible for 1.6 per cent of total industrial withdrawals.
It is important to note that industrial and thermal-electric water withdrawals are fundamentally different from net consumption. Water withdrawal measures the total amount removed from the watershed, including volumes that are returned. When water is used for cooling by industry, the net consumption is often 10 per cent or less of the gross withdrawal. It is also important to note that almost all industrial water in Canada is taken directly from the watershed and is not purchased from a water utility. Water pricing for industrial purposes refers to any fees associated with water allocations, not to the cost of municipal water.
Average residential water use per person dropped slightly from 335 litres per day in 2001 to 327 litres per day in 2006.3 Domestic water use includes drinking water, as well as all water withdrawn for homes, municipalities, commercial establishments, and public services like hospitals.
Residential water use per capita is generally lower in cities and larger communities than in smaller communities. For example, residential per capita water use averaged 294 litres per day in cities with a population greater than 500,000 or more, compared with 496 litres per day in municipalities with a population of between 2000 and 5000.4 This may be linked to water metering and volume-based pricing. Homes, institutions, and businesses in cities and larger communities are more likely to have water meters than those in smaller communities. Municipalities that charge according to the volume of water used have a lower average daily consumption rate.
Main agriculture water uses include irrigation (85 per cent) and livestock watering (15 per cent). Irrigation needs differ among the various regions of Canada. Some areas, such as southern Alberta, have a relatively large portion of land under irrigation. Other regions, such as Quebec, have a very small portion of the arable land under irrigation. Irrigation is needed mainly in the drier parts of Canada, such as the southern regions of Alberta, British Columbia, and Saskatchewan. These regions account for 85 per cent of all irrigation in Canada.
Some water users are more efficient than others. When the amount of water returned to the environment is taken into account, the proportions change considerably. Water use in agriculture is particularly inefficient, returning less than 30 per cent of water consumption.5 That’s why agriculture represents the largest consumer of water in Canada.
Why does Canada do so poorly on this indicator?
Many peer countries have succeeded in decreasing freshwater withdrawals, Canada included. But Canada’s per capita withdrawals remain higher than all of its peers except the United States. Environment Canada reports that, “despite improvements in household water conservation, Canada remains one of the largest per capita users of fresh water in the world.”6
Excessive water household consumption in Canada can be attributed to a lack of widespread water conservation practices. This may be due to the fact that only 72 per cent of Canada’s households were metered in 2009 and that water pricing does not promote efficiency.7 Municipalities price water in one of two ways:
- flat-rate pricing approach: Households are charged the same price for water regardless of the amount used. This is a common approach in municipalities with no water metering.
- volume-based pricing approach: Municipalities charge for water based on the actual amount of water used. In 2009, unmetered households used a daily average of 376 litres per person compared with 229 litres per person by metered households.8
Footnotes
1 Environment Canada, Informational Resources and Services / Water—How We Use It (accessed August 19, 2008).
2 Data in this paragraph are from Statistics Canada, Industrial Water Use, 2009—Updated (Ottawa: Statistics Canada, 2012), 8–9.
3 Environment Canada, 2010 Municipal Water Use Report (Ottawa, Environment Canada, 2010), 3.
4 Environment Canada, 2010 Municipal Water Use Report (Ottawa, Environment Canada, 2010), 4.
5 L.J. Gregorich and D.R. Coote, The Health of Our Water: Toward Sustainable Agriculture in Canada (Ottawa: Agriculture and Agri-food Canada, May 2000) (accessed August 19, 2008).
6 Environment Canada, “Residential Water Use Indicator” (accessed November 12, 2012).
7 Environment Canada, “Residential Water Use Indicator” (accessed November 12, 2012).
8 Environment Canada, “Residential Water Use Indicator” (accessed November 12, 2012).