
PM10 Concentration
Key Messages
- Canada earns a “B” grade for particulate matter (PM10) concentration and ranks 8th out of 17 countries
- Canada’s PM10 concentration was 1.6 times greater than the best performer, Sweden, in 2009.
- Canada has reduced PM10 concentration by 37 per cent since 1990.
Putting particulate matter into context
Particulate matter (PM) is one of many pollutants that contribute to reduced air quality in Canada. Concentrations of PM are caused by both human activities and natural occurrences.
Exposure to these particles can cause a range of health problems, including aggravated cardiac and respiratory diseases such as asthma, bronchitis, emphysema, and various forms of heart disease.1 Children, the elderly, and people with respiratory disorders are particularly susceptible. Other toxic air pollutants can bind to the PM that is already in the air, creating additional health risks. PM exposure is a hazard for urban and rural Canadians and can affect any region of Canada year-round.
PM can also harm vegetation, materials, and buildings. When PM is deposited on metals, wood, stone, painted surfaces, and fabrics, it may cause soiling and discoloration, in addition to physical and chemical degradation of these materials. PM may also accumulate on plant surfaces and leach into soils, increasing a plant’s susceptibility to disease.2
PM, along with other air pollutants, contributes to reduced visibility and regional haze.3
How does particulate matter concentration in Canada compare to that of its peer countries?
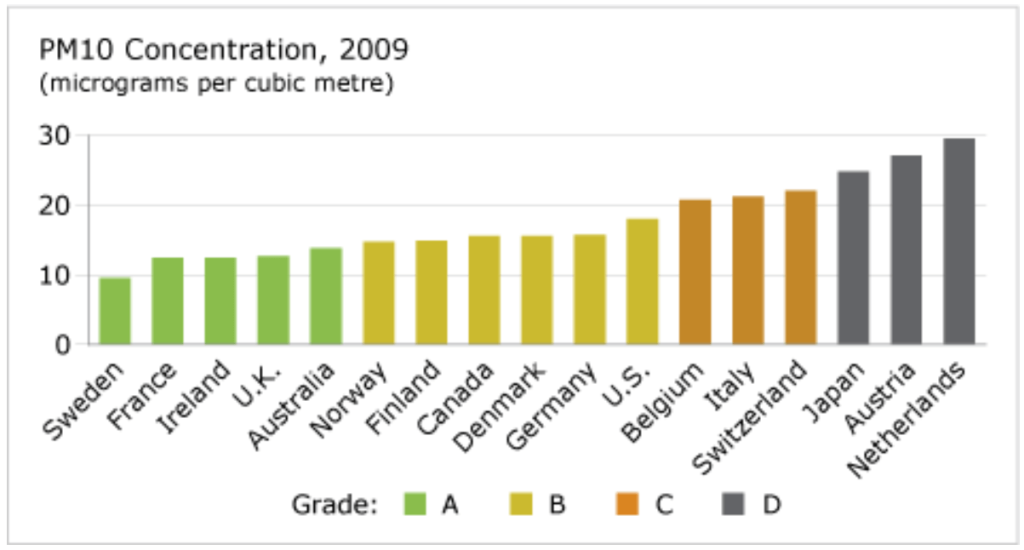
Canada ranks 8th out of 17 OECD countries and earns a “B” grade for PM10 concentration. Six Western European countries, along with Australia, have lower particulate concentration. Sweden was the best performer in this category, with a concentration of 9.7 in 2009. Canada’s PM10 concentration was 1.6 times greater than Sweden’s, at 15.7. The poorest performers were Japan, Austria, and the Netherlands, who earned “D”s for urban PM10 concentrations that were almost three times that of the best performer.
What progress have Canada and its peers made in reducing particulate matter?
Canada has reduced its PM10 concentration by 37 per cent since 1990. The U.K. and Italy each reduced their concentration by 48 per cent.
Has Canada’s report card on particulate matter concentration improved?
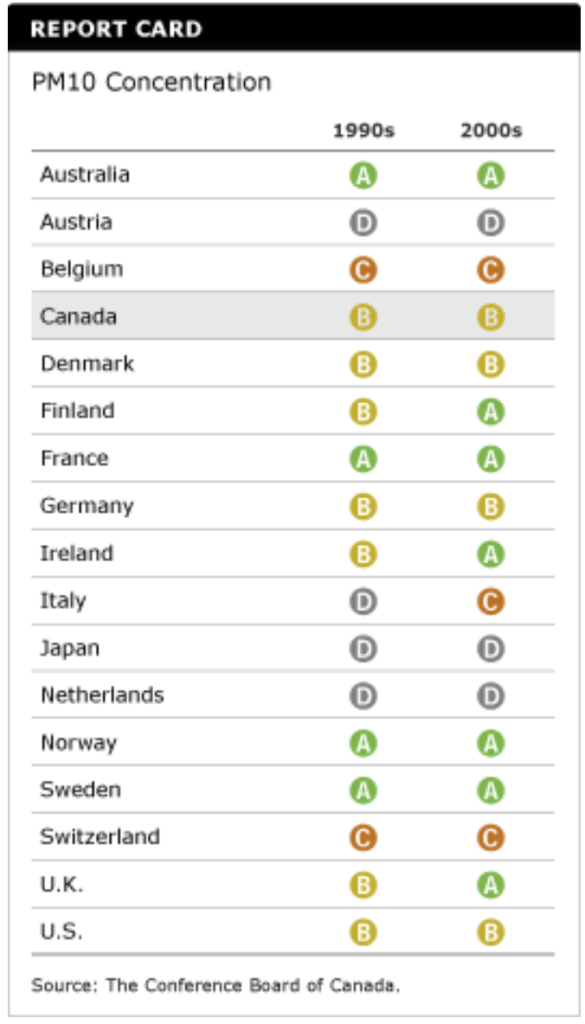
Despite a reduction in PM10 concentration, Canada has maintained its “B” grade because other countries have made more progress.
Finland and the U.K. moved up to “A”s in the 2000s.
Austria, Japan, and the Netherlands are laggards on this indicator, maintaining a “D.”
The U.S. has higher absolute levels of urban PM10 concentration, but its progress mirrors that of Canada. Between 1990 and 2009, the U.S. decreased concentrations by 39 per cent, maintaining its “B” grade.
What is the science behind particulate matter concentration?
A considerable proportion of PM concentration is the result of human activities, including mineral dust due to mining and extraction, windblown agricultural soil, VOCs from vehicles, industrial processes and solvents, sulphates and nitrates from power plants and transportation sources, and road and construction dust.4 Natural emissions of PM include wildfires, windblown dust, sea salt spray, some mineral particles, natural nitrogen oxide (NOx), and some VOC emissions.
PM10 refers to particulate matter that is 10 micrograms per cubic metre or less in diameter. PM10 is generally subdivided into a fine fraction of particles 2.5 micrograms per cubic metre or less (PM2.5) and a coarse fraction of particles larger than 2.5 micrograms per cubic metre.
PM10 are referred to as “inhalable coarse particles” and are found near roadways and dusty industries.
PM2.5 are “fine particles” found in smoke and haze and can be directly emitted from sources such as forest fires. They also form when gases emitted from power plants, industries, and automobiles react in the air.5
What is Canada doing to reduce particulate matter concentration?
So far, legislators have focused on reducing PM2.5 concentration. In June 2000, the federal, provincial, and territorial governments, except Quebec, signed the Canada-Wide Standards for Particulate Matter (PM) and Ozone, committing them to significantly reducing PM2.5 by 2010. Because air quality varies by region, each jurisdiction is required to create a unique implementation plan to reduce particulate matter concentration.
Between 2003 and 2005, most places with PM2.5 levels above or approaching (within 10 per cent of) the 2010 Canada-wide standard of 30 micrograms per cubic metre were in southern Ontario. Outside Ontario, only two communities in the B.C. Interior had levels above the standard, and none was within 10 per cent of it.6
Standards have yet to be created for PM10. The current PM2.5 standards, however, are an important first step toward the long-term goal of minimizing the risks of pollutants to human health and the environment. According to the Canadian Council of Ministers of the Environment, the PM2.5 standards represent a balance between achieving the best health and environmental protection possible and the feasibility and costs of reducing the pollutant emissions that contribute to PM and ground-level ozone in ambient air.7
What are the main sources of particulate matter in Canada?
In Canada, sources of PM10 emissions can be broken down as follows:8
- industrial sources, 42 per cent—including the coal industry, pulp and paper industry, non-ferrous mining and smelting, iron and steel production, wood industry, and mining and quarrying
- forest fires, 28 per cent
- non-industrial fuel combustion, 15 per cent—including commercial and residential fuel combustion, residential woodstoves and fireplaces, and electric power generation
- transportation, 11 per cent—including gasoline and diesel vehicles and trucks, propane-powered vehicles, railroads, marine craft, aircraft, and tire wear
- incineration, 2 per cent—including wood waste and other types of incineration.
- miscellaneous sources, 2 per cent—including building fires, pesticides and fertilizer application, cigarette smoking, and the marine cargo handling industry
Footnotes
1 Environment Canada, “Particulate Matter” (accessed November 22, 2012).
2 Environment Canada, “Particulate Matter” (accessed November 22, 2012).
3 Health Canada, National Ambient Air Quality Objectives For Particulate Matter—Executive Summary, December 9, 2007 (accessed August 19, 2008).
4 Caitlin Hancey, Particulate Matter, Ground-Level Ozone, and the Canada-Wide Standards Regulatory Process, December 1999 (accessed August 19, 2008).
5 U.S. Environmental Protection Agency, Particulate Matter, June 12, 2007 (accessed August 19, 2008).
6 Canadian Council of Ministers of the Environment, Canada-wide Standards for Particulate Matter and Ozone: Five Year Report: 2000–2005 (Ottawa: Canadian Council of Ministers of the Environment, November 2006), 5.
7 Canadian Council of Ministers of the Environment, Particulate Matter & Ground-level Ozone, April 2008 (accessed August 19, 2008).
8 Health Canada, National Ambient Air Quality Objectives For Particulate Matter—Executive Summary, December 9, 2007 (accessed August 19, 2008).