
Municipal Waste Generation
Key Messages
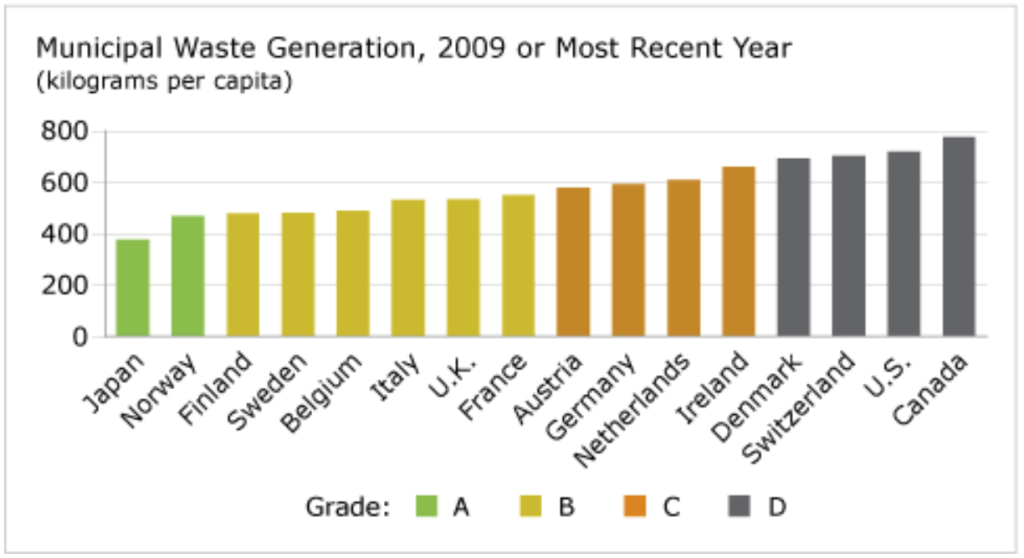
- Canada ranks in last place out of 17 countries and gets a “D” grade on the municipal waste generation report card.
- Canada produced 777 kg per capita of municipal waste in 2008, twice as much as the best performer, Japan.
- Canada’s municipal waste generated per capita has been steadily increasing since 1990.
Putting municipal waste in context
Any waste collected by or on the order of municipalities falls under the definition of municipal waste. According to the Organisation for Economic Co-operation and Development (OECD), municipal waste is “waste from households, including bulky waste, similar waste from commerce and trade, office buildings, institutions and small businesses, yard and garden waste, street sweepings, the contents of litter containers, and market cleansing waste.”1
How does Canada perform relative to its peer?
Canada generates more municipal waste per capita annually than any of its peer countries. Canada earns a “D” grade and ranks in last place. In 2008, Canada generated 777 kg per capita of municipal waste—well above the 17-country average of 578 kg per capita and twice as much as Japan, the top-performing country.
Why do Canadians generate so much municipal waste?
Increases in municipal waste generation are related to rates of urbanization, types and patterns of consumption, household revenue, and lifestyles. Canada’s per capita income and average household disposable income have been steadily increasing since the 1980s, leading to increasing household consumption rates.
In other OECD counties where urbanization and disposable household income are also high, however, municipal waste generated per capita is substantially lower than in Canada. Japan, for example, generated 377 kg per capita of municipal waste in 2008, while Norway generated 470 kg per capita in 2009.
For information on Japan’s and Finland’s innovative approaches to sustainable waste management, see the hot topic “What can Canada learn from other countries to improve its Environment report card?”
Has Canada’s report card on municipal waste improved?
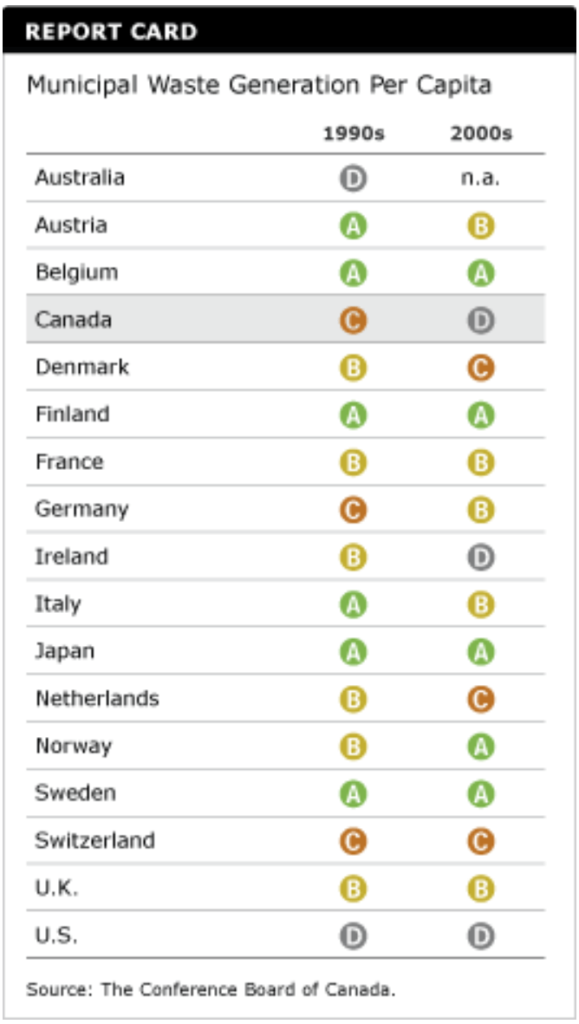
No. In the 1990s, Canada received a “C” grade. Australia and the U.S. had higher per capita municipal waste than Canada.
But by 2002, Canada’s per capita municipal waste was worse than in the United States. Canada’s grade fell to a “D.”
Is Canada the only country to see a steady increase in municipal waste?
No. Across the OECD, the quantity of municipal waste generated per capita has been rising. In 1995, for example, the average amount of municipal waste generated by the 17 countries ranked by the Conference Board was 536 kg per capita. By the late 2000s, the average had increased to 578 kg per capita.
Some of Canada’s peer countries have, however, managed to keep the amount of municipal waste generated per capita steady, despite economic growth. Between 1990 and 2007, Japan sustained its municipal waste generation at about 400 kg per capita, while Norway managed to reduce its per capita volumes of disposable solid waste. However, most other countries recorded significant increases in municipal waste generation.
What are the environmental issues associated with municipal waste?
Municipal waste contributes to environmental problems including habitat destruction, surface and groundwater pollution, and other forms of air, soil, and water contamination. Incineration creates toxic substances, while landfills emit methane (which contributes to global warming) and other gases.2
Does Canada manage its municipal waste in a sustainable way?
In 2008, nearly 13 million tonnes of waste were generated by Canadian households.3 Of this, more than 8.5 million tonnes were disposed of in landfills or incinerators; the remaining 4.4 million tonnes were diverted through recycling, reuse, or composting. Paper fibres and organic materials make up the largest proportion of household material that is recycled and composted in Canada.4
Within each province, individual municipalities are responsible for waste management programs. Many Canadian municipalities have developed and initiated successful recycling programs that reduce the amount of waste that goes to landfills. Recycling, which has significantly increased in Canada, generally has less impact on the environment than manufacturing new materials into usable products. For example, studies have shown that producing paper from recycled materials uses less energy and creates fewer air and water emissions and less solid waste.5 But recycling operations still require energy and water, and can cause a number of environmental impacts. They therefore need to be managed effectively.6
Landfilling is still the most common way to dispose of waste in Canada. Most municipal waste goes to landfill, with only a small percentage incinerated.7 Environmental concerns about landfills include the leachate and landfill gases that contaminate groundwater and surface water and contribute to climate change.
Municipalities are consequently faced with finding a viable and sustainable location for waste disposal. Although there is ample space to create landfill sites in Canada, many residents are opposed to having landfills close to their communities. In the 1990s, when Toronto’s Keele Valley landfill reached near capacity and closure appeared imminent, the municipality proposed shipping its waste 590 kilometres north, by rail, to Kirkland Lake, Ontario. The 9,000 residents of Kirkland Lake were up in arms at the thought of having Toronto’s municipal waste dumped into an abandoned mine in their community. In the end, the community won, and the decision to use the mine was overturned by Toronto City Council. Between 2003 and 2010, Toronto’s municipal waste was exported to a landfill site in Michigan, but transporting waste has other environmental impacts. As of January 1, 2011, all of Toronto’s waste requiring landfill disposal is now sent to its Green Lane Landfill Site in southwestern Ontario.8
What does Canada need to do to improve its sustainable waste management practices?
Municipal waste management is expensive. Municipal governments in Canada spent more than $1.8 billion on waste collection, transport, and disposal in 2008.9
Canada needs to further integrate waste management systems while making reduced environmental impact a top priority. To achieve more sustainable municipal waste management practices, the challenge will be to reduce the amount of solid waste generated, while increasing the amount of waste diverted from landfills through recycling and other initiatives in an economically feasible way. Canadians must also realize that economic growth cannot come at the expense of the environment.
For information on how some cities are adopting the concept of industrial ecology to reduce waste, see:
“Environmentally Sound Growth” in chapter 4 of Mission Possible: Successful Canadian Cities.
Footnotes
1 OECD, OECD Environmental Data Compendium 2004 (Paris: OECD, 2005).
2 David R. Boyd, Canada vs. the OECD: An Environment Comparison, 2001 (accessed August 19, 2008).
3 Statistics Canada, Waste Management Industry Survey: Business and Government Sectors 2008 (Ottawa: Statistics Canada, 2010), Catalogue no. 16F0023X, 14.
4 Ibid., 16.
5 P.T. Williams. “Emissions from Solid Waste Management Activities,” in Environmental and Health Impact of Solid Waste Management Activities, R.E. Hester and R.M. Harrison, eds. (Cambridge: The Royal Society of Chemistry, 2002).
6 Statistics Canada, Human Activity and the Environment, Annual Statistics 2005, Solid Waste in Canada (Ottawa: Minister of Industry, 2005), 7.
7 David R. Boyd, Canada vs. the OECD: An Environment Comparison, 2001 (accessed August 19, 2008).
8 City of Toronto, “Facts about Toronto’s trash” (accessed June 15, 2011).
9 Statistics Canada, Waste Management Industry Survey: Business and Government Sectors 2008 (Ottawa: Statistics Canada, 2010), Catalogue no. 16F0023X, 8.