
Marine Trophic Index
Key Messages
- Canada ranks in last place out of 15 peer countries for the change in the Marine Trophic Index over 2000 to 2006.
- Canada receives a “D” grade for performance on this indicator.
- The sustainability of Canada’s fish resources has been in decline since the 1970s.
Putting the Marine Trophic Index in context
The Marine Trophic Index has been endorsed by the Convention on Biological Diversity as a measure of marine biodiversity. It measures overall ecosystem health and stability, but also serves as a proxy measure for overfishing. The word trophic means “of or relating to nutrition,” so the index is a measure of the richness and abundance of large, higher-trophic-level fish species.
By examining the change in the Marine Trophic Index over time, the degree to which a county is altering fish stocks in the marine ecosystem is revealed. If the change is negative, it means the overall trophic structure of the marine ecosystem is becoming depleted of larger fish higher up the food chain, and smaller fish are being caught. However, if the change in the Marine Trophic Index is zero or positive, the fishery is either stable or improving. The change in the index is thus an indicator of the sustainability of each country’s fish resources.
To calculate the Marine Trophic Index, each fish or invertebrate species is assigned a number based on its location in the food chain. Carnivores are assigned high numbers, and herbivores lower ones. The index is calculated from datasets of commercial fish landings by averaging trophic levels for the overall catch.1
Are Canada’s fish resources sustainable compared to those of its peers?
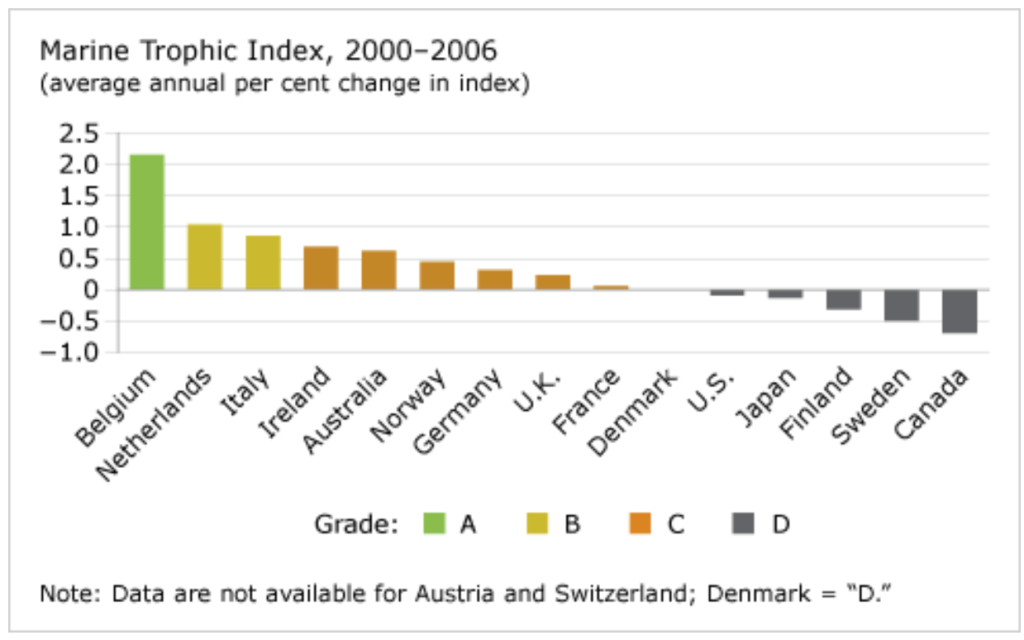
Canada ranks in last place among 15 peer counties for this indicator and receives a “D” grade. Between 2000 and 2006, Canada’s Marine Trophic Index declined by an average of 0.69 per cent per year. This indicates that the sustainability of Canada’s fish resources is at risk and that Canada has been fishing down the food chain.
In comparison, Belgium has managed to improve upon its fish resources; its Marine Trophic Index increased by 2.2 per cent per year. Belgium was the only OECD country to receive an “A.” But eight other countries also achieved a positive increase in their Marine Tropic Index.
How has Canada performed historically on this indicator?
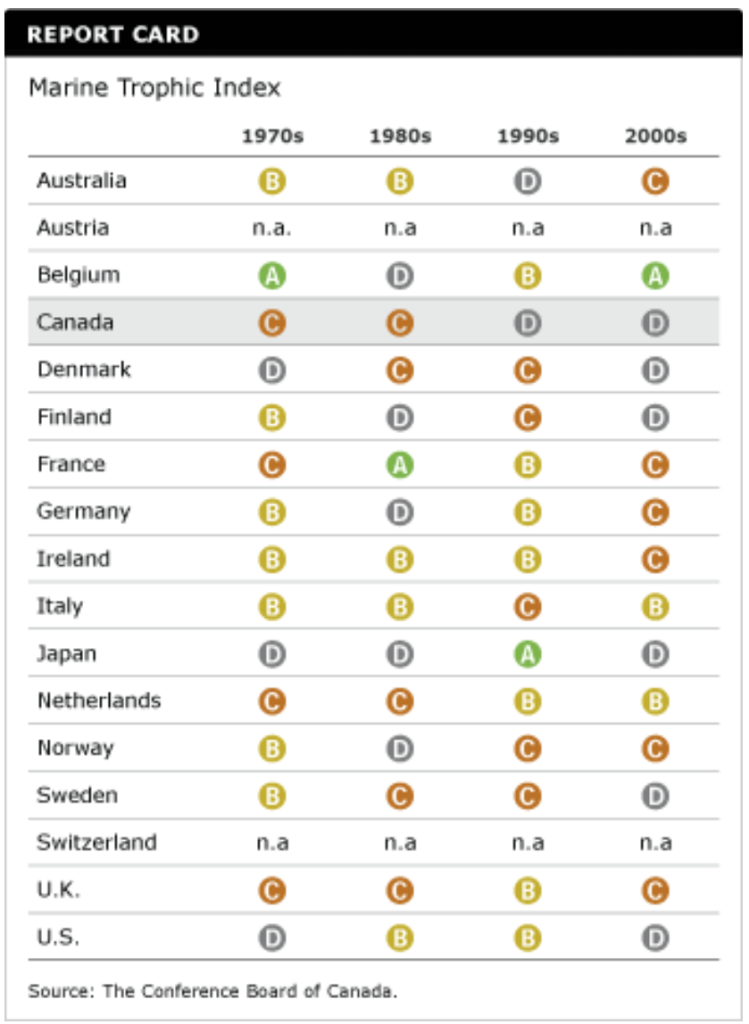
The sustainability of Canada’s fish resources has been in decline since the 1970s. Throughout the 1970s and 1980s Canada earned a “C” for the change in its Marine Trophic Index. By the 1990s and over 2000 to 2006, Canada’s Marine Trophic Index steadily declined, getting a “D” grade.
Canada has made some progress by applying a precautionary approach, integrated management, fishing capacity reductions, and selected fishing strategies. But more can be done to achieve sustainable fisheries. According to the OECD, Canada should continue to strengthen partnerships among stakeholders through international agreements, and continue to improve regulatory regimes and enforcement mechanisms.2
Increases in information exchange, research, monitoring, and enforcement along with a continued effort to reduce overfishing in Atlantic fisheries will contribute to sustainability over the long term.
Footnotes
1 Yale Center for Environmental Law & Policy, Environmental Performance Index: Marine Trophic Index, 2008 (accessed August 20, 2008).
2 OECD, Environmental Performance Review: Canada (Paris: OECD, 2004), 184.