
Energy Intensity
Key Messages
- Canada ranks in last place out of 17 peer countries and earns a “D” grade.
- Canada has reduced its energy intensity by 39 per cent since 1971.
- In 2009, Canada used 0.25 toe per US$1,000 of GDP, significantly more than the 17-country average of 0.15 toe.
Putting energy intensity in context
A common way to measure energy intensity is to look at the ratio of energy production and use to GDP. This is a better measure than per capita energy use because energy use is affected, to a large degree, by per capita income. Measuring energy production and use per unit of gross domestic product (GDP) controls for the effect of country income.
To measure energy intensity, we use a country’s primary energy supply per unit of GDP. Primary energy supply refers to all energy produced within a nation in its raw form—crude oil, coal, hydro, raw natural gas, etc. Primary energy supply measures energy before it is transformed into the fuels we use (crude oil vs. gasoline, coal vs. electricity, etc.) and therefore includes energy used in conversions from one form to another (in power generation, for example). It also reflects all energy production, including energy that is supplied to export markets. But it does not include energy imported from other nations.
Increasing energy efficiency and reducing energy intensity should be a policy goal for Canada and its peer countries as a way to mitigate climate change and conserve energy. For a sustainable energy future, Canada must encourage economic activity and GDP growth that does not rely on increased energy consumption.
Is it possible for Canada to significantly reduce energy intensity?
Canada’s industrial structure, vast geography, and cold climate make it a highly energy-intensive country. Countries with more favorable economic and geographic conditions are generally less energy intensive than Canada. Canada’s energy intensity also reflects our role as a significant energy exporter.
How does Canada’s energy intensity compare to that of its peer countries?
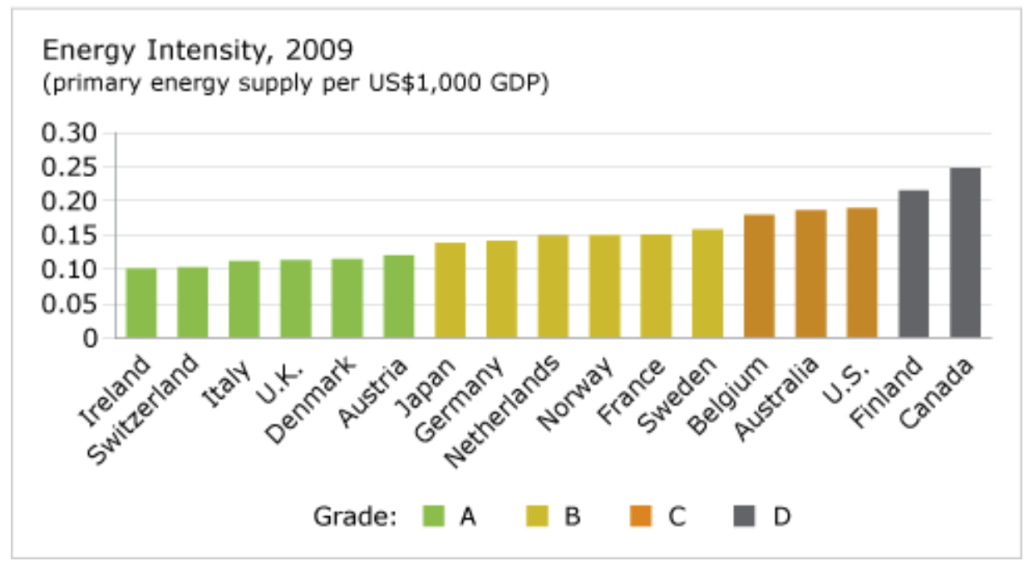
Canada ranks in last place out of 17 peer countries and earns a “D” grade for energy intensity. In 2009, Canadian primary energy supply was 0.25 tonnes of oil equivalent (toe) per US$1,000 GDP—significantly more than the peer country average of 0.15 toe. Primary energy supply in the top country, Ireland, was only 0.10 toe. The U.S. used 0.19 toe and receives a “C” grade.
Finland, the other “D” performer, is similar to Canada in that its industrial structure is highly energy intensive. In a review of Finland’s environmental performance, the OECD noted Finland’s prominence of energy intensive industries, such as pulp and paper, and steel.1
Is Canada becoming more energy efficient?
On a more positive note, Canada has reduced its energy intensity over the past few decades. Since 1971, energy intensity has fallen by 39 per cent. Ireland, the best performer on this indicator, decreased its energy intensity by 64 per cent over the same period. The U.S. managed a reduction of 54 per cent.
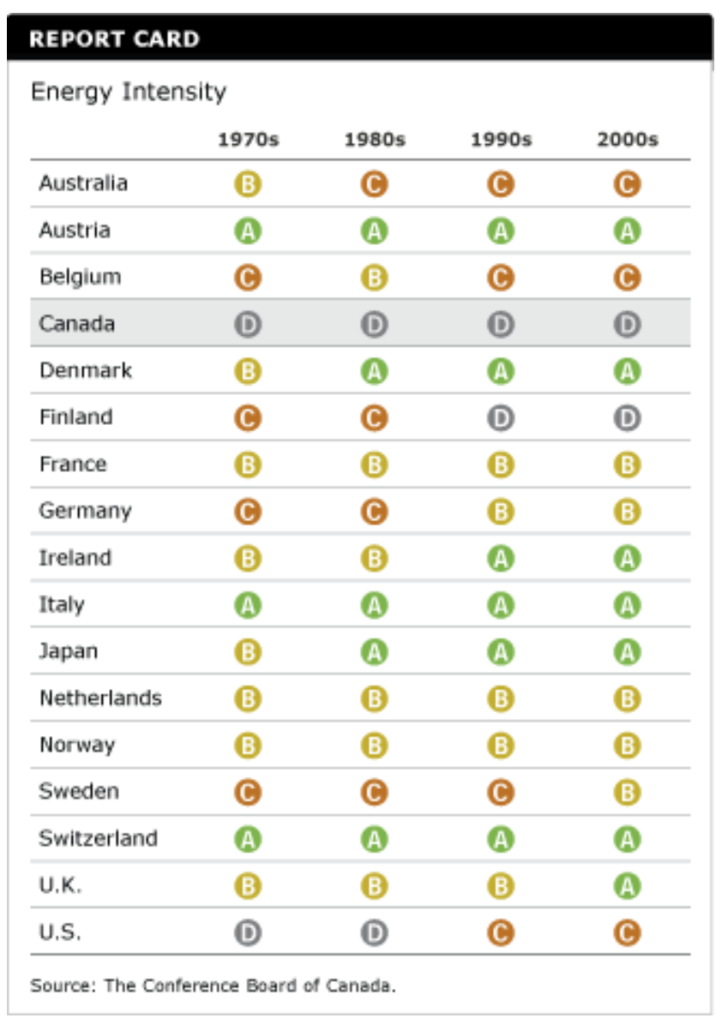
Still, compared with its peers, Canada has been a “D” performer for four decades. The U.S. moved up from a “D” to a “C” in the 1990s.
Use the drop-down menu to compare the change in Canada’s energy intensity with that of its peer countries.
How did Ireland find itself at the top of the class?
Ireland—this year’s top performer—achieved a 64 per cent reduction in energy intensity between 1971 and 2009, and maintained lower energy intensity than Canada for four decades. As the most energy-efficient peer country, Ireland used 0.10 toe (tonnes of oil equivalent) per US$1,000 of GDP in 2009. A review of Ireland’s environmental performance by the OECD said the country’s reduction in energy intensity was closely linked to three factors:
- economic restructuring toward low-intensity industries that are also high value-added
- increased efficiency in electricity generation
- economic growth that increased faster than energy consumption2
Footnotes
1 OECD, OECD Environmental Performance Reviews: Finland 2009 (Paris: OECD, 2009), 51.
2 OECD, OECD Environmental Performance Reviews: Ireland 2009 (Paris: OECD, 2009), 145–46 and 159.