
Low-Emitting Electricity Production
Key Messages
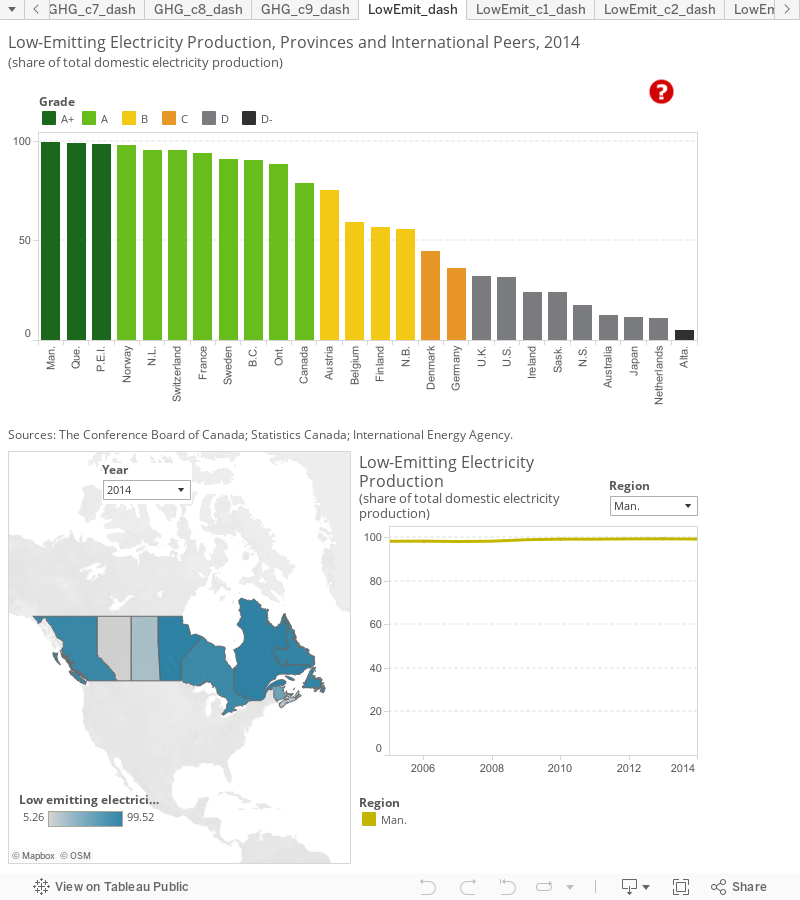
- Manitoba, Quebec, and P.E.I. produce a higher proportion of low-emitting electricity than any of Canada’s international peers, earning the provinces “A+” grades. Newfoundland and Labrador, British Columbia, and Ontario also perform well, receiving “A”s.
- Alberta, Nova Scotia, and Saskatchewan are the worst-performing provinces, with Alberta producing only about 5 per cent of its electricity from low-emitting sources, ranking below all international peers.
- Hydro power, the largest low-emitting source of electricity across Canada, dominates electricity production in many provinces.
Putting renewable and nuclear energy in context
Sources of energy that produce low amounts of greenhouse gas (GHG) emissions include wind, tidal, solar, biomass, nuclear, hydroelectric, and geothermal.
Increasing renewable energy’s share of total energy consumption should be a policy goal to mitigate climate change in Canada and its peer countries. Nuclear electricity generation may also have a role to play in reducing Canada’s carbon output.
How do the provinces rank relative to Canada’s international peers?
Manitoba, Quebec, and P.E.I. score “A+” grades for ranking above all of Canada’s peer countries. In Manitoba, virtually all domestic electricity production is from low-emitting sources, with almost all power generated by hydro. Newfoundland and Labrador (95 per cent) also ranks highly, earning an “A” and placing only slightly behind the top-ranked peer country, Norway (98 per cent). B.C. (91 per cent) and Ontario (89 per cent) also get “A”s, ranking just below Switzerland (95 per cent), France (94 per cent), and Sweden (91 per cent), and helping Canada (79 per cent) as a whole earn an “A” as well.
New Brunswick (56 per cent) is a middle-of-the-pack performer, ranking 15th and scoring a “B” grade. The province places below other “B” jurisdictions Austria (76 per cent), Belgium (59 per cent), and Finland (57 per cent).
Saskatchewan (24 per cent) and Nova Scotia (18 per cent) do poorly on this indicator, receiving “D” grades. These provinces, which rely heavily on fossil fuel combustion for electricity generation, rank below both the U.S. and the U.K. (32 per cent each), which are also “D” performers. Alberta, producing only 5 per cent of its electricity from low-emission sources, ranks below the Netherlands (11 per cent), the worst-ranked peer country, and earns a “D–” grade.
How do the provinces perform relative to each other?

Manitoba, Quebec, and P.E.I. are at the top of the class, followed closely by Newfoundland and Labrador and by British Columbia. In all five provinces, over 90 per cent of electricity is generated from low-emitting power sources. Ontario is also an “A” performer, doing significantly better than the remaining provinces. Saskatchewan, Nova Scotia, and Alberta are the lowest-ranked provinces. In bottom-ranked Alberta, only 5 per cent of electricity is generated from low-emitting sources.
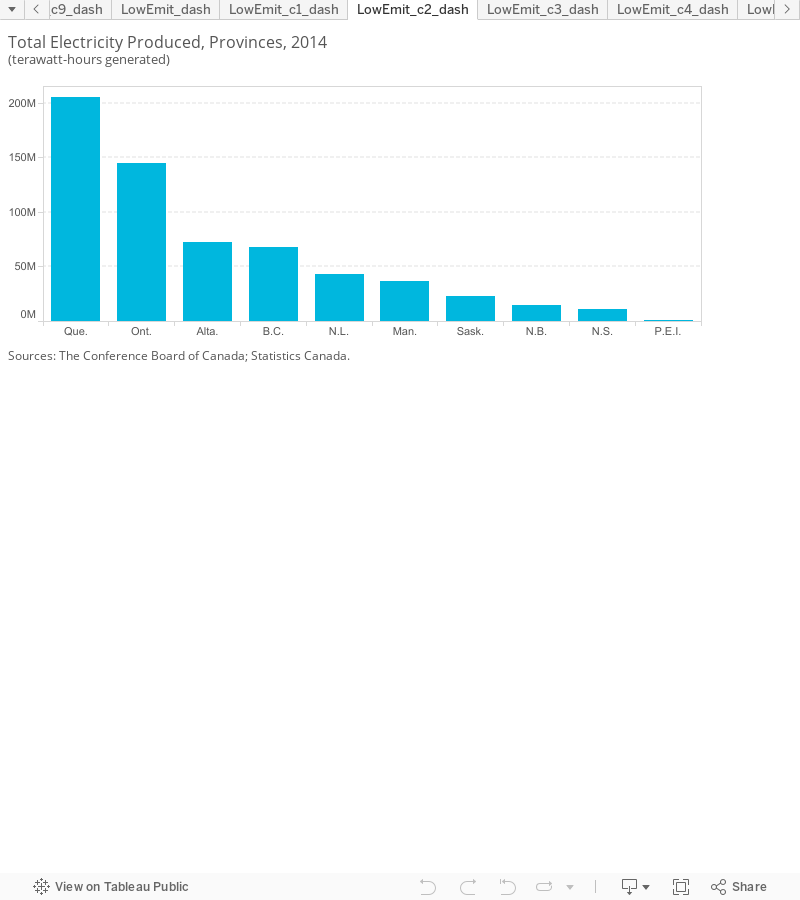
The difference in total electricity generated in each province affects provincial performance on this indicator, however. While P.E.I. scores an “A+” grade, for example, the province actually produces a very tiny amount of electricity and instead relies on electricity imports.
How do the territories fare on low-emitting electricity production?
Yukon is an “A” performer, with 95 per cent of its electricity coming from non-combustion sources. The Northwest Territories rely more heavily on combustion to generate electricity, and score a “C” grade for producing only 33 per cent of their electricity from low-emitting sources. Nunavut is a “D–” performer with none of its electricity coming from low-emission sources. Like P.E.I., each of the territories produces only a very small portion of Canada’s electricity; collectively their production accounts for only 0.2 per cent of total national production.
The territories are not included in the overall provincial and international benchmarking calculations because data for each individual territory were not available for several of the indicators included in the overall environment report card. The Conference Board is, however, committed to including the territories in our analysis, and so we provide information on territorial performance when data are available.
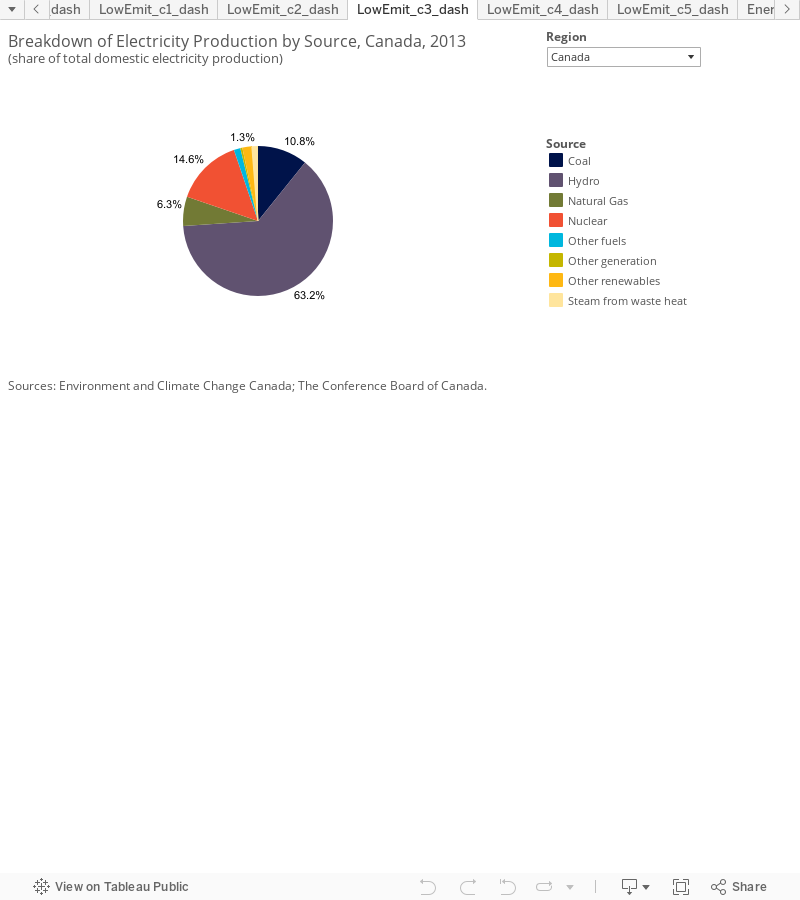
Why is there such a broad range of power generation across Canada?
Because of Canada’s huge geographical size, the provinces have access to different natural resources and, as a result, rely on different sources of electricity generation. The pie chart shows each source’s share of the total bulk electricity generated by facilities typically referred to as “utilities.”1 It doesn’t include electricity produced by individuals or businesses that generate electricity for their own use—these producers account for roughly 9 per cent of total electricity generated in Canada.
“A+” and “A” performers
Manitoba: Almost all of Manitoba’s power (about 97 per cent) comes from hydro, with the bulk of the rest coming from other renewables. Combustion of fossil fuels accounts for only 0.25 per cent of the province’s electricity.
Quebec: Hydroelectric power generation has played a dominant role in Quebec’s past and continues to do so today. Around 98 per cent of Quebec’s electricity comes from hydro, with the rest split fairly evenly between fossil fuel combustion and other renewables.
Prince Edward Island: Back in the 1990s and early 2000s, all of P.E.I.’s electricity was generated by burning fossil fuels. Since 2000, there has been a large increase in the use of wind power to generate electricity in P.E.I., while fossil-fuel-based electricity generation has been mostly phased out. By 2014, renewables (primarily wind) accounted for over 98 per cent of P.E.I.’s generated electricity. During this time, the amount of electricity produced in P.E.I. increased by roughly a factor of 10, and the amount of renewable electricity generated in P.E.I. since 2008 has surpassed the total provincial electricity generation totals in all prior years. Despite this large increase in wind capacity, P.E.I. is unable to produce enough electricity to meet its peak demand, even when all wind generators are operating at full capacity.2 Also, wind-generation occurs sporadically, and so P.E.I.’s main source of electricity operates intermittently. P.E.I. thus still imports a substantial amount of electricity from New Brunswick (over 50 per cent of the electricity consumed in 2014).3
Newfoundland and Labrador: Almost all electricity generated in Newfoundland and Labrador is from hydro (roughly 97 per cent). The bulk of the rest is produced from fossil fuels other than coal or natural gas (such fuel oil and diesel), with a very small portion coming from non-hydro renewables.
British Columbia: Hydro stations produce 92 per cent of B.C.’s electricity, with the bulk of the rest coming from fossil fuel combustion (natural gas or other non-coal fuels) and a small amount of other renewables.
Yukon: Electricity generated in the Yukon comes primarily from hydro, with only 5 per cent coming from fossil fuel combustion.
Ontario: Nuclear generation accounts for over half of the total power generated. Hydro also plays a prominent role, and produces over one-quarter of the electricity in the province. Although all coal plants have been phased out over the last decade, natural gas combustion is still used to generate over 10 per cent of Ontario’s electricity. Other renewables and steam from waste heat are also used in small proportions (collectively about 5 per cent).
Middle-of-the-pack performers
New Brunswick: The electricity produced in New Brunswick comes from a variety of sources. Fossil fuels have become much less prominent since the early 2000s, although they still account for over one-third of the province’s total production. New Brunswick relies on nuclear generation for roughly one-third of its power, with the rest being split among hydro, other renewables, and steam produced from waste heat.
Northwest Territories and Nunavut: Of the small amount of electricity produced in the Northwest Territories and Nunavut, roughly 60 per cent is produced by hydro plants, and the rest through fossil fuel combustion (a small amount of natural gas, but mostly other non-coal fuels such as fuel oil and diesel).
Lowest-ranking provinces
Saskatchewan: Most of Saskatchewan’s electricity is generated through fossil fuel combustion (over 70 per cent). Coal accounts for roughly two-thirds of this. The bulk of the low-emitting electricity comes from hydro, with a small amount coming from other renewables and from steam from waste heat.
Nova Scotia: Nova Scotia has historically relied heavily on coal combustion to produce electricity. In recent years, coal’s share of electricity production has decreased somewhat and been replaced with natural gas, which emits fewer greenhouse gases per kilowatt-hour of electricity than coal. However, this means that Nova Scotia still depends heavily on fossil fuels to generate power, with only 17 per cent of its power generated from non-combustion sources (hydro and other renewables).
Alberta: Most of Alberta’s electricity is produced by combusting fossil fuels (nearly 90 per cent). Most of this electricity comes from coal, with around 25 per cent coming from natural gas. The remaining 10 per cent of Alberta’s electricity comes from hydro, other renewables, and steam from waste heat.
Is low-emitting electricity production the best indicator?
While low-emitting electricity production provides a strong indication of the impact of electricity generation on a region’s GHG emissions, it does not tell the whole story. Emissions resulting from combustion can vary significantly across different fossil fuels. Coal used in Canada, for example, produces roughly 1.05 kilograms of carbon dioxide equivalent (CO2e) emissions per kilowatt-hour (kWh) of electricity produced, whereas natural gas produces only half that amount (0.55 kg per kWh).4
An ideal indicator to use would be a region’s total emissions per kWh, averaged across all sources of electricity production. While it is not possible to make comparisons of that sort on an international scale, data for Canada and the provinces are available for electricity produced by utilities (but not electricity generated by individuals and businesses for their own use).5
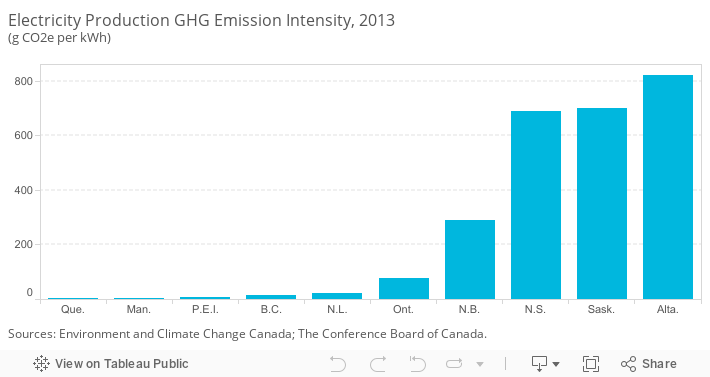
Looking at electricity production emission intensity across the provinces, the same broad patterns emerge. Quebec, Manitoba, P.E.I., and B.C. all perform very well, producing less than 20 grams of CO2e per kWh of electricity produced. Newfoundland and Labrador and Ontario also perform relatively well, producing fewer than 100 g CO2e per kWh. New Brunswick does poorly in comparison, producing around 300 g CO2e per kWh. Nova Scotia, Saskatchewan, and Alberta remain the worst performers by a wide margin, producing 700–800 g CO2e per kWh, which amounts to several hundred times the emission intensity of Quebec, the best-performing province.
The provincial rankings on electricity production emission intensity are very similar to the low-emitting electricity production rankings. All six provinces that score “A” or “A+” grades on low-emitting electricity production have much lower emission intensities than the provinces that score “B” grades or worse. Thus, low-emitting electricity production is indeed a good proxy for measuring emission intensity.
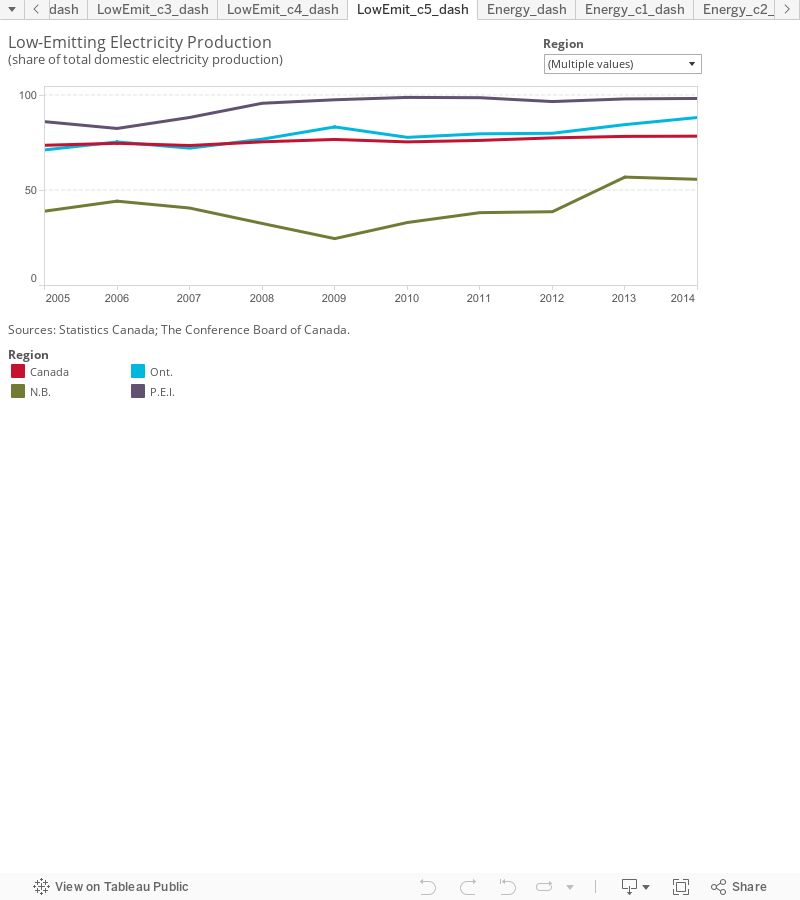
How have the provinces performed historically?
Since 2005, the proportion of electricity generated from low-emitting sources in Canada has increased from 74 per cent to 79 per cent. Provincial and territorial performance over this time has been variable. Most provinces with very high proportions of low-emitting electricity generation (Newfoundland and Labrador, Manitoba, Quebec, and British Columbia) have remained pretty constant over this time period, generally producing more than 90 per cent of their electricity from low-emitting sources.
The largest increases in low-emitting electricity generation over the past decade have been in Ontario, New Brunswick, and Prince Edward Island. Ontario’s share increased from 71 to nearly 89 per cent as it phased out its coal power plants. New Brunswick’s share climbed from 39 to 56 per cent as it used less electricity generated through combustion. And P.E.I.’s share rose from 86 to 99 per cent as it increased its wind capacity by over 10 times. Nova Scotia made modest gains, increasing its share of low-emitting electricity production by 8 percentage points, from 10 to 18 per cent.
The only region to have a noticeable overall decrease in low-emitting electricity generation is the Northwest Territories, which decreased from 49 per cent in 2005 to 36 per cent in 2014. Here, significant combustion capacity has been added on in recent years, almost exclusively by individuals and businesses that do not function as utilities.
How significant are indirect sources of GHG emissions resulting from electricity production?
The low-emitting electricity generation report card focuses on energy sources that have low or no GHG emissions that result directly from electricity generation (in contrast to the combustion of fossil fuels, for example, which directly results in GHG emissions). However, this indicator does not take into account GHGs that are emitted indirectly as a result of electricity generation. All forms of electricity generation create some indirect “upstream” emissions (such as emissions resulting from the manufacturing of solar panels or generation equipment, the extraction and refining of fuels, etc.). Unfortunately, indirect emissions are difficult to measure, and comparable data are not available across all jurisdictions and generation technologies.
For Canada, GHGs emitted indirectly as a result of hydro power are particularly significant. Canada is the world’s second-largest producer of hydro power (behind China)6 and contains some of the largest hydro dams in the world. Although few GHGs are produced during hydro power generation (typically ranging from 4 to 14 g of CO2e per kWh,7 compared with coal, for example, which emits roughly 1,000 g of CO2e per kWh8), additional emissions can result from flooding done to create reservoirs for hydro dams. Aside from the direct harm to flora and fauna from the flooding, carbon dioxide and methane are released when flooded vegetation and soil decompose.
Averaged over the life cycle of a hydro plant, indirect emissions can increase the net GHGs emitted to over 150 g of CO2e per kWh.9 However, the volume of these indirect emissions varies dramatically between different hydro sites, depending on the local vegetation composition, the amount of flooding, the topography of the land, and the climate. Hydro dams in tropical countries, for instance, typically have higher indirect emissions than hydro dams in temperate areas like Canada.10 Also, not all hydro power installations create these indirect emissions; run-of-river hydro power, which does not require the creation of a reservoir and generally operates on a smaller scale than hydro dams, does not typically generate incremental GHGs from decomposing vegetation.
The omission of indirect emissions from our comparison should be kept in mind, particularly when considering the strong performance of provinces that rely heavily on hydro power (namely Manitoba, Quebec, Newfoundland and Labrador, and B.C.). While the indirect, or upstream, GHG emissions from hydro plants may be lower than those for coal or natural gas plants,11 proportionately they are much larger relative to their direct emissions.
Footnotes
1 The pie chart data include electricity generated by facilities classified under North American Industry Classification System (NAICS) code 22111 (“Electric Power Generation”).
2 Government of Prince Edward Island Department of Transportation, Infrastructure, and Energy, P.E.I.: World Leader in Wind Power Development (accessed October 5, 2015).
3 Determined using volumes of electricity produced in New Brunswick and consumed in P.E.I. reported by NB Power’s System Information Archive (accessed February 3, 2016).
4 Calculated from data in Environment Canada, National Inventory Report 1990–2013, Part 3, 72.
5 Data are based only on electricity generated by facilities classified under NAICS code 22111 (“Electric Power Generation”).
6 International Energy Agency, Key World Energy Statistics 2015, 19.
7 Intergovernmental Panel on Climate Change, IPCC Special Report on Renewable Energy Sources and Climate Change Mitigation (Cambridge: Cambridge University Press, 2012), 471.
8 Calculated from Environment Canada, National Inventory Report 1990–2013, Part 3, 72.
9 Intergovernmental Panel on Climate Change, IPCC Special Report on Renewable Energy Sources and Climate Change Mitigation, 472.
10 Ibid., 473.
11 A study by ICF International (Life Cycle Greenhouse Gas Emissions of Natural Gas) finds that upstream emissions generated from the production of coal and natural gas range from roughly 20 g to 90 g CO2e per kWh equivalent. However, this range would underestimate the upstream emissions from electricity generated using coal or natural gas, because the electricity conversion efficiency of combustion technologies is lower than 100 per cent. In other words, the combustion of 1 kWh equivalent of coal or natural gas generates less than 1 kWh of electricity. If we assume, for example, a conversion efficiency of 50 per cent, the net upstream emissions for a coal or natural gas power plant would be about 40 to 180 g CO2e per kWh of electricity generated.