
VOC Emissions
Key Messages
- The top-ranking province, Ontario, gets a “B” and places 13th among the 26 comparator regions.
- Canada gets a “D” and has the highest VOC emissions per capita among all the peer countries.
- Saskatchewan, Alberta, and Newfoundland and Labrador are at the bottom of the pack, scoring “D–” grades.
Putting VOC oxides emissions in context
Volatile organic compounds (VOCs) are produced by vehicle emissions, chemical manufacturing, the evaporation of automotive fuels and other petroleum-based products, and chemical solvents. Consumer and commercial products that often contain VOCs include household cleaning products, personal care products, paints, and printing inks.
In high concentrations, VOCs react with nitrogen oxides (NOx) to form ground-level ozone, and with other airborne particles to form particulate matter (PM). These are both components of smog, which hurts human health and the environment. Children, people with respiratory diseases (such as asthma), and people who work or exercise outside are susceptible to damage to lung tissue and reduction in lung function from exposure to smog. Ozone, typically generated in urban centres, can be transported by wind currents and affect regions far from its original source, damaging vegetation and crop yields in rural areas. Crops such as wheat, corn, soybeans, and tomatoes are particularly sensitive to ground-level ozone.
How do the provinces rank relative to Canada’s international peers?
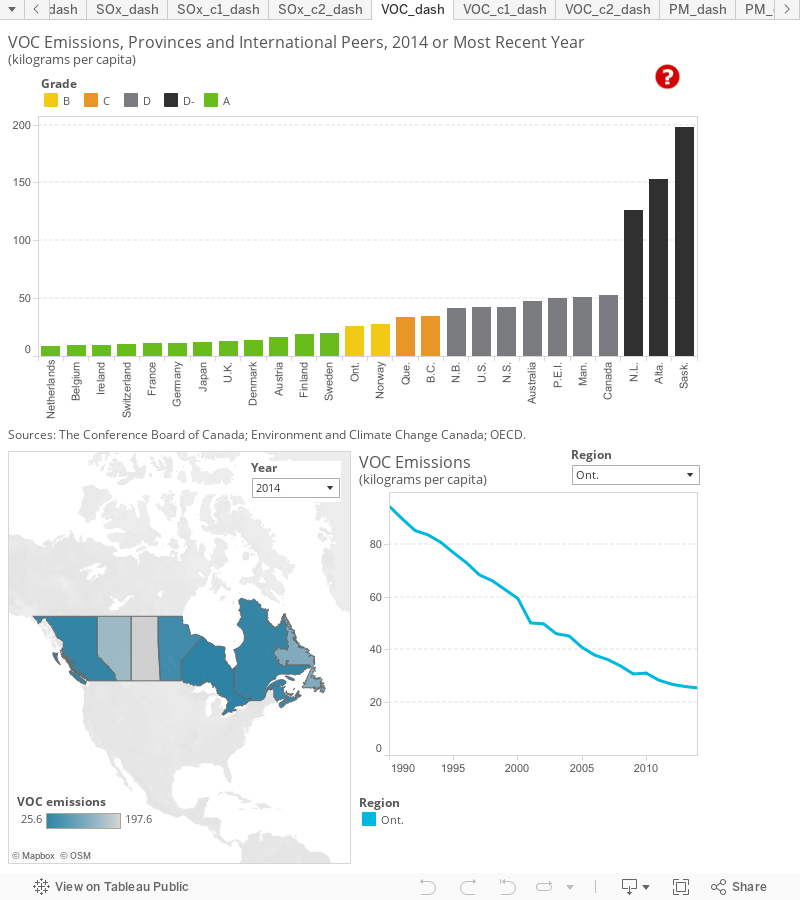
Most provinces do poorly relative to international peers. Ontario is the highest-ranking province, scoring a “B” grade and placing 13th overall with a VOC emission rate of 25.6 kg per capita. Quebec (33.7) and B.C. (34.2) are the next best performing provinces, scoring “C”s and ranking just below Norway (27.4) and ahead of the U.S. (42.3), a “D” performer.
New Brunswick (41.6), Nova Scotia (42.7), P.E.I. (50.5), and Manitoba (51.3) all earn “D” grades but rank above the national average. Canada has the highest VOC emissions per capita among all the peer countries. The country’s emission rate of 52.5 kg per capita is over 6 times greater than that of the Netherlands (8.6), the top-ranking peer.
Saskatchewan (197.6), Alberta (153), and Newfoundland and Labrador (125.9) have the highest emission rates among all the jurisdictions and get “D–” grades. Saskatchewan’s VOC emission rate is nearly 4 times the national average and over 20 times the rate in the Netherlands.
How do the provinces perform relative to each other?
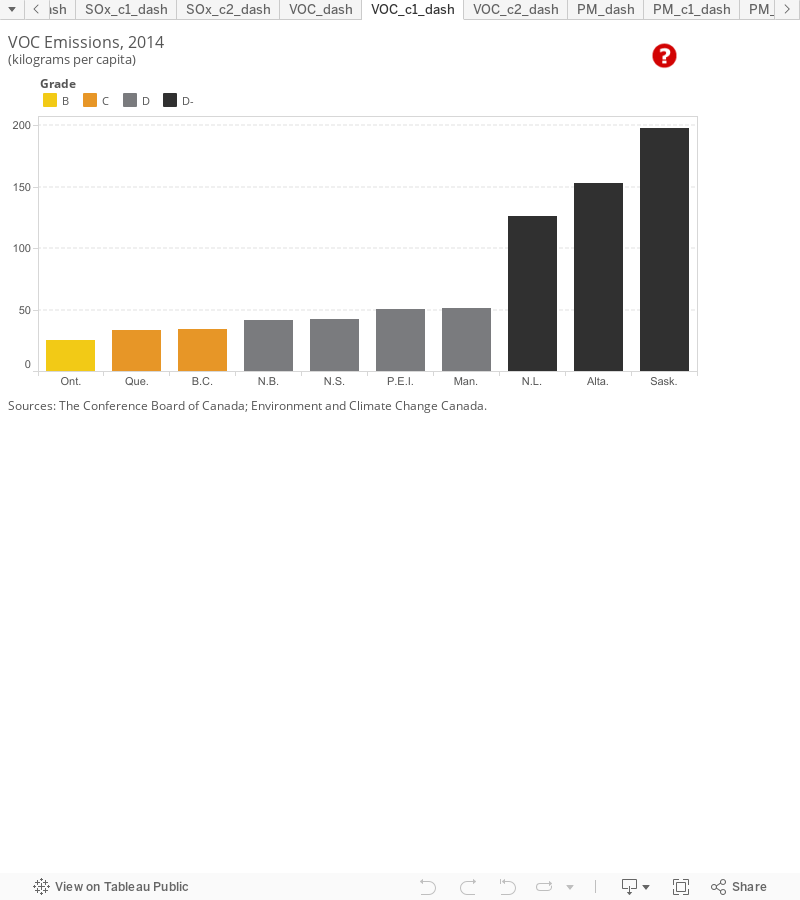
With emission rates between 25 and 35 kg per capita, Ontario (25.6), Quebec (33.7), and B.C. (34.2) are the highest-ranking provinces. New Brunswick, Nova Scotia, P.E.I., Manitoba all score “D”s but are in the middle of the pack among the provinces, with the latter two having emission rates close to the national average.
Saskatchewan, Alberta, and Newfoundland and Labrador are the worst ranked by a huge margin, with emission rates ranging from 126 kg per capita in Newfoundland and Labrador to 198 kg per capita in Saskatchewan. The emission rates of these three provinces are between two and four times the national average, and between four and eight times the emission rate of the best-performing province, Ontario.
How do the territories fare on VOC emissions?
All three of the territories have high VOC emission rates and are “D–”performers. Yukon and the Northwest Territories have VOC emission rates of 75 and 78 kg per capita, respectively, putting them well ahead of Newfoundland and Labrador, but well behind the national average. Nunavut produces 201 kg of VOC emissions per capita, an emission rate comparable to that of the worst-ranked province, Saskatchewan.
Nunavut also does poorly on VOC emissions; as with NOx emissions, a large volume of VOCs come from off-road vehicle use. However in the case of VOCs, the proportion attributed to off-road vehicles is much higher: roughly 94 per cent of VOCs in Nunavut are emitted by off-road vehicles, including recreational and commercial/industrial vehicles.1
The territories are not included in the overall provincial and international benchmarking calculations because data for each individual territory were not available for several of the indicators included in the overall environment report card. The Conference Board is, however, committed to including the territories in our analysis, and so we provide information on territorial performance when data are available.
How has the performance of Canada and the provinces changed over time?
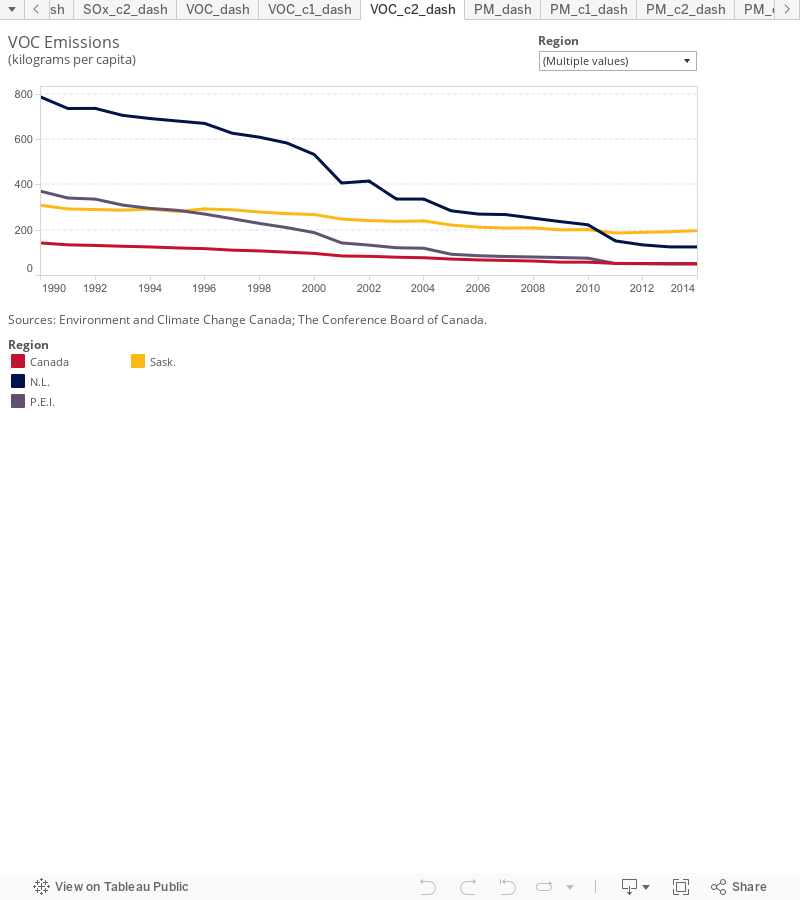
Canada has made significant improvements to its VOC emission rate since 1990. Between 1990 and 2014, per capita VOC emissions dropped from 144 kg to 53 kg, a reduction of 63 per cent. Each province and territory made large cuts to its VOC emissions rates, ranging from a 36 per cent reduction in Saskatchewan to an 86 per cent reduction in Prince Edward Island. In absolute terms, the biggest reduction over this time period was achieved by Newfoundland and Labrador, which reduced per capita emissions from nearly 800 kg in 1990 to 126 kg in 2014, a reduction of 84 per cent. This is largely a result of reduced emissions from off-road vehicles.
What contributes to VOC emissions in Canada?
VOC emissions result from both natural sources and human activities. Natural sources of VOCs include vegetation and forest fires. Although natural sources of VOC emissions are larger overall, human activities in populated and industrialized areas are the main contributors to air quality problems.
The oil and gas industry is the largest contributor to VOCs in Canada (with 39 per cent of emissions), followed by transportation (22 per cent), and the use of paints and solvents (14 per cent). The remaining emissions are split roughly evenly among agriculture, home firewood burning, and other sources.2 Given that the oil and gas industry is concentrated in Alberta, Saskatchewan, and Newfoundland and Labrador, it is not surprising that these provinces have the highest VOC emission rates in the country.
What is Canada doing to reduce VOC emissions?
Canada has significantly reduced VOC emission rates over the past 20 years, largely thanks to cleaner technology and fuels for vehicles, reductions in industrial VOC emissions, and lower levels of VOCs in paints, solvents, and cleaners. However, given that Canada still has a higher emission rate than all its peer countries, there is much room for improvement.
In 2012, the Canadian Council of Ministers of the Environment (an intergovernmental council that facilitates cross-jurisdictional environmental action across the territorial, provincial, and federal governments), with the exception of Quebec, agreed to implement a nationwide air quality management system—a set of guidelines for monitoring emissions and setting emissions standards. The system contains air quality standards—set out in the Canadian Ambient Air Quality Standards (CAAQS)—for fine particulate matter (PM2.5) and ozone. Standards for nitrogen dioxide (NO2) and sulphur dioxide (SO2) are being established. The air quality management system also defines air zones (within provinces and territories) and regional airsheds (across provincial and territorial boundaries) to guide cross-jurisdictional cooperation to achieve the CAAQS. Further, it establishes base-level industrial emission requirements to unify emissions standards for industry in Canada (including VOC emissions) and requires that ambient air quality and emissions data be publicly available.
Footnotes
1 Environment and Climate Change Canada, Air Pollutant Emission Inventory, (accessed March 22, 2016).
2 Ibid.