
Use of Forest Resources
Key Messages
- Manitoba has the lowest forest use intensity among the provinces, harvesting less than 15 per cent of its annual allowable cut.
- New Brunswick has the highest forest use intensity in Canada and has been harvesting more than its annual allowable cut in recent years.
- Canada as a whole harvests only 69 per cent of its annual allowable cut, indicating that Canada’s forestry industry is sustainable.
Putting forest use in context
Preserving forests, particularly primary and old-growth forests, is key to preserving biodiversity and contributing to a country’s overall environmental health. The assumption is that the higher the percentage of timber cut relative to annual productive capacity, the greater the stress on the forest environment. OECD defines “annual productive capacity” as “either a calculated value, such as annual allowable cut, or an estimate of annual growth for existing stock.”1 For Canada and the provinces, we use the annual allowable cut (AAC) established by each province to represent annual productive capacity—that is, the annual forest growth.
It should be noted, however, that each province calculates its AAC differently, and so it is not clear how closely each AAC matches each province’s annual reproductive capacity. Ontario, for example, measures its AAC in terms of area (measured in hectares), while the other provinces specify a volume of lumber (measured in cubic metres) that can be harvested.
The relationship between timber cut and the renewal of timber stocks is a central concern of sustainable forest resource management. Harvest rates that exceed the growth in annual productive capacity indicate that the forest is being harvested more quickly than it is being replaced, which is not sustainable in the long run.
While it would be preferable to compare Canadian and provincial forest use intensity with peer country performance, no comparable data are available. OECD reports forest use intensity figures that are calculated similarly to the values we calculate here, but considers total “fellings” (including trees that are felled but left in the forest), while the available Canadian data consider only “removals” (which include only lumber that is taken out of the forest). Another problem with the data is that the AACs specified by the province are not comparable to the annual productive capacity estimates used by OECD to generate its measure of forest use intensity.
Because the Canadian data are not comparable to OECD data, we do not make international comparisons for this measure, nor do we grade the provinces. Instead, we simply present their forest use intensities, so that we can compare the relative pressure that each province exerts on its forest environment. That said, all provinces that do not exceed their annual allowable cut are harvesting sustainably, meaning that they can continue their current harvesting rates without threatening the long-term maintenance of their forests.
How do the provinces perform relative to each other?
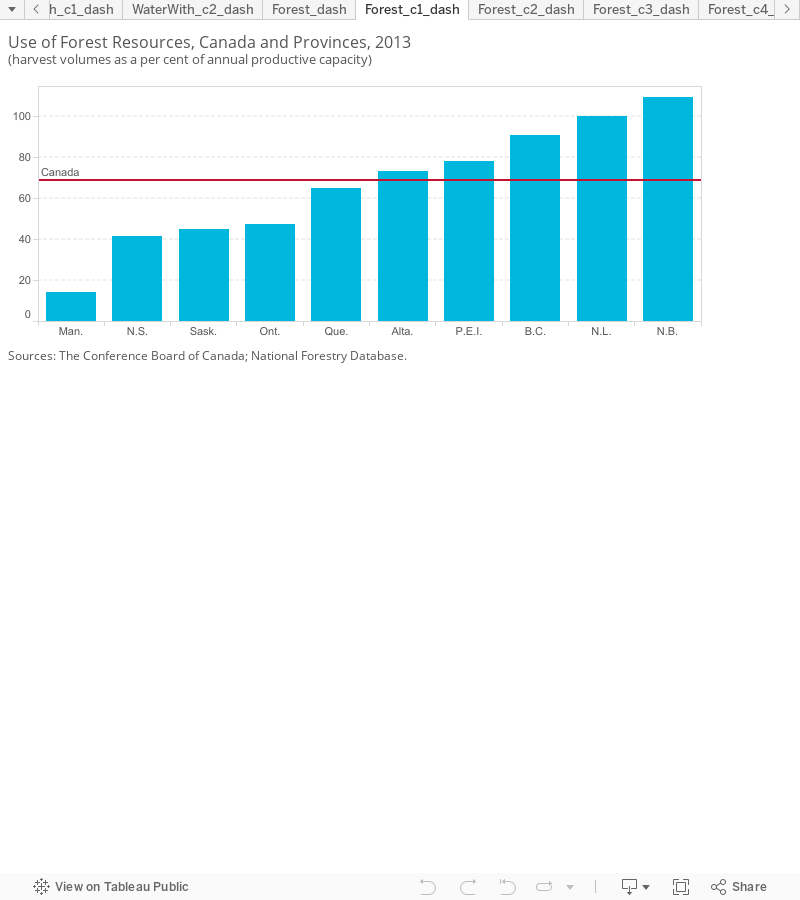
Manitoba is, by a wide margin, the province with the lowest forest use intensity, harvesting only 14 per cent of its annual growth.
The other top-performing provinces are Nova Scotia (42), Saskatchewan (45), and Ontario (47). These provinces harvest between 41 and 47 per cent of their AAC—three times the use rate of Manitoba.
Quebec’s forest use rate of 65 per cent is just below the national average (69 per cent) and over four times that of Manitoba. Alberta and P.E.I. harvest also have forest use intensity rates comparable to the national average, at 73 and 78 per cent, respectively.
B.C. has the highest forest use intensity rates of all provinces that are harvesting at a sustainable rate, and harvests about 91 per cent of its AAC.
Newfoundland and Labrador and New Brunswick both have very high forest use rates, and harvest roughly all of their AAC. In 2013, New Brunswick’s harvest rate was above 100 per cent, indicating that its timber harvest is not sustainable, while Newfoundland and Labrador’s harvest made up 100 per cent of its AAC.
How do the territories fare on use of forest resources?
While the available data for Nunavut and the Northwest Territories are insufficient to calculate their use of forest resources, data are available for Yukon. This territory has a forest use rate of only 19.8 per cent. Thus, the territory is second behind Manitoba. Of course, the territories have little in the way of forests with commercial value. The forestry industry, measured across all three territories, produces less than $1 million GDP per year and is less than one-quarter of the size of P.E.I.’s forestry industry (the smallest among all provinces). So, there is much less forest harvesting pressure in the territories than in the provinces.
Does the size of a region’s forestry industry affect its forest use intensity?
The use of forest resources within each province is tied to the local forestry industry. It is therefore possible that provinces with larger forestry industries will have higher intensities of forest use than countries with smaller industries. All else being equal, larger industries are likely to harvest more than smaller industries, and so regions with large industries should be more likely to harvest close to their annual productive capacity.
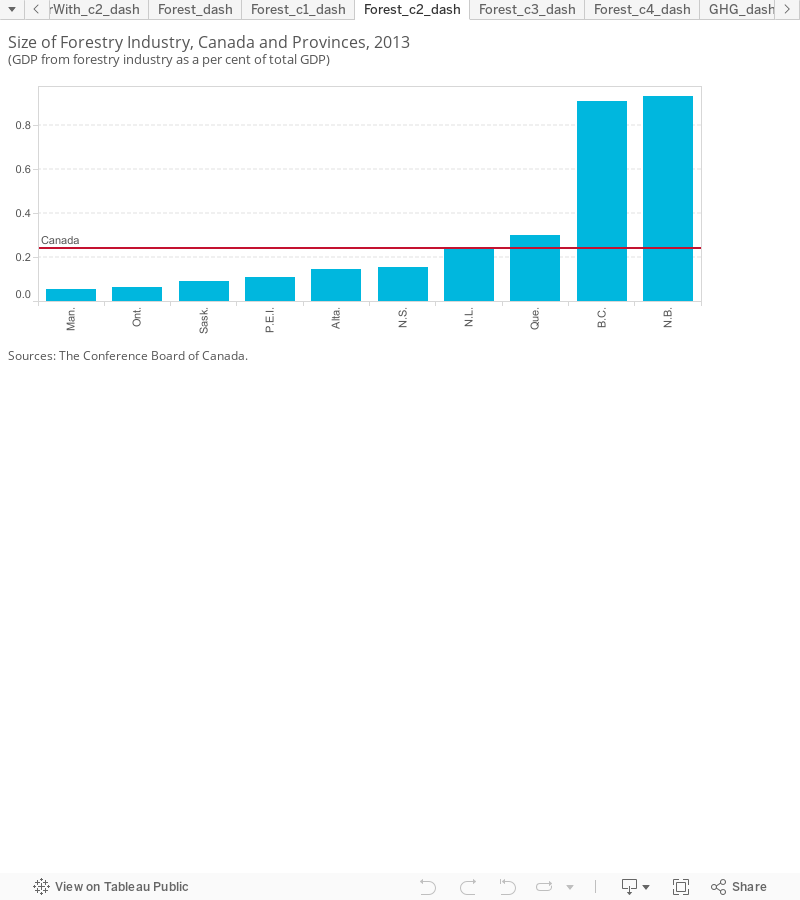
Comparing the size of each province’s forestry industry with its total GDP suggests there is a relationship between the size of the forestry industry and the intensity of forest use in some regions. New Brunswick, for example, has the largest forestry industry (relative to the size of its overall GDP) and also has the highest forest use intensity. Similarly, Manitoba, which has the lowest intensity across the provinces, also has the smallest forestry industry among the provinces. Nova Scotia, however, has the second-lowest forest use intensity but has a larger forestry industry than five other provinces. Similarly, B.C.’s forestry industry is over three times the size of Newfoundland and Labrador’s, but B.C.’s forest use intensity is lower.
The fact that the relationship between the size of the forestry industry and the intensity of forest use does not appear to be consistent across provinces indicates that other factors also have a large impact on forest use intensity. The amount of commercially viable forested area in a province relative to the total forested area likely influences forest use intensity. Perhaps more significantly, AACs are calculated differently across provinces. Those with more stringent annual allowable cuts will be penalized by this measure, as they will appear to be harvesting a larger proportion of their AAC than would be the case if they had more generous allowances.
How has forest use in the provinces changed over time?
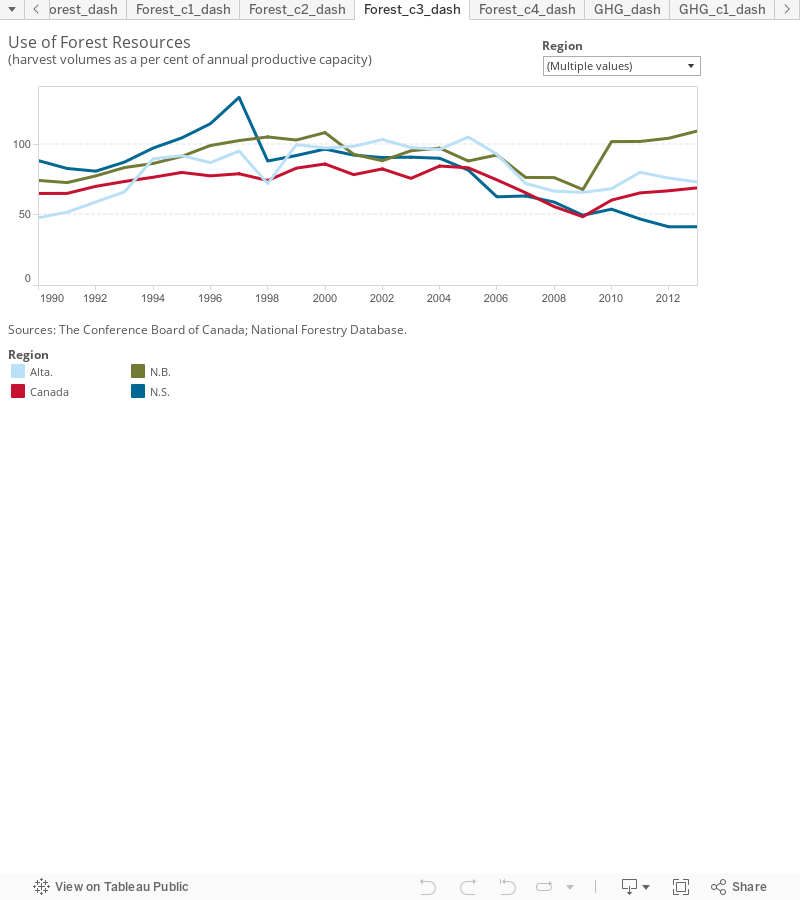
Canada as a whole saw its forest use increase slightly from 65 per cent in 1990 to 69 per cent in 2013, but there was substantial variation over this period. Forest use increased through the early 1990s before plateauing in the late 1990s and early 2000s, but decreased again during the mid-2000s. After the low of 49 per cent in 2009 (a result of the global recession), Canada’s use of forest resources steadily increased, hitting 69 per cent in 2013.
Individual provincial performance was highly variable, although most provinces have increased forest use since 1990. New Brunswick saw its forest use increase from 74 per cent in 1990 to 109 per cent in 2013. New Brunswick’s forest use intensity has been greater than 100 per cent since 2010, suggesting that its recent rate of harvesting is unsustainable. Alberta has also undergone a large increase in its use of forest resources, from 48 per cent in 1990 to 73 per cent in 2013. Despite the high growth in the harvest rate, Alberta’s forest use appears to remain sustainable since the harvest rates remain within the annual allowable cut.2
Smaller increases in forest use have been observed for P.E.I. and Quebec; as with Alberta, their current practices appear to be sustainable, even if their harvesting rates have increased. The remaining provinces, Newfoundland and Labrador, Manitoba, and Saskatchewan have all undergone only very small net changes to their use of forest resources, and in 2013 were at harvesting levels that were comparable to those of 1990.
A few provinces have, on net, decreased their forest use intensity since 1990. Nova Scotia, in particular, has seen its forest use drop from 88 per cent in 1990 to 42 per cent in 2013. Smaller reductions have been recorded by B.C. and Ontario, which have decreased forest use intensities by 7 to 8 per cent.
How is timber harvested in Canada?
In Canada, 92 per cent of the forest area harvested is clear-cut, making clear-cutting the most common harvesting method. Clear-cutting removes most of the trees from an area, while leaving patches of trees intact to help the forest regrow after the harvest. In comparison, the selection system removes single trees or small groups for timber at relatively short intervals to protect the quality and value of the entire forest area.3 Commercial thinning is a similar practice, where particular trees are selected for harvesting to promote tree growth.4
Clear-cutting is favoured in Canada’s boreal forest because it resembles natural disturbances such as fire, wind, floods, and insects and allows the forest to regenerate naturally. Harvesting is done in blocks, strips, or patches to mimic natural disturbance patterns. But although clear-cutting allows for forest regeneration, it can also lead to a loss of biodiversity. Depending on the characteristics of the forest in question, one or more harvesting methods may be used.
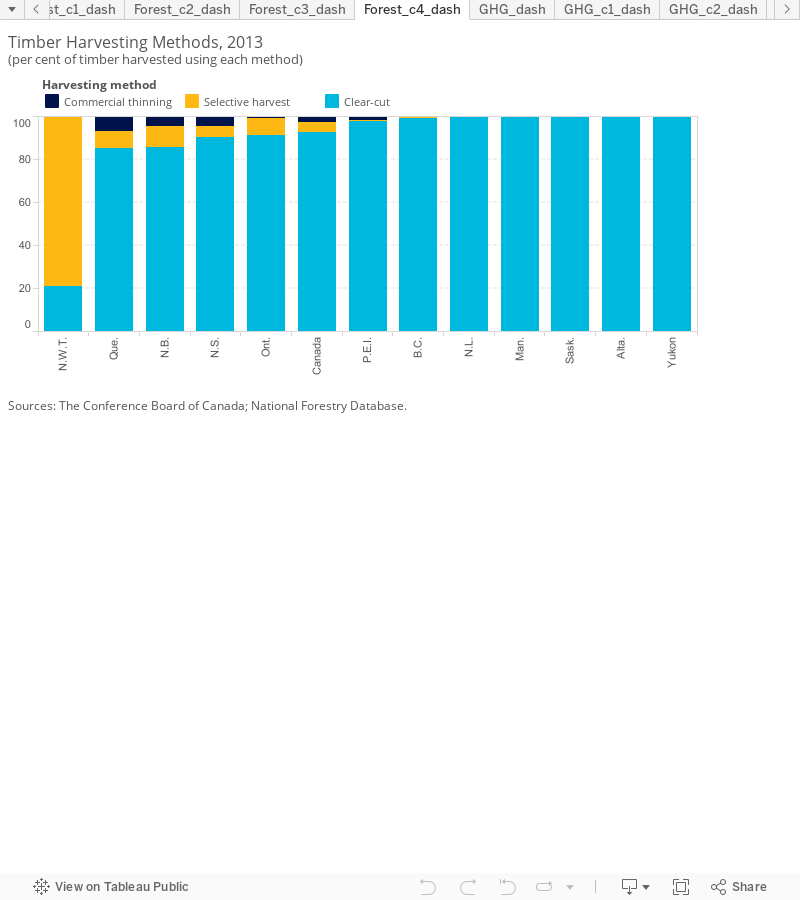
Clear-cutting is, by a wide margin, the predominant method of timber harvesting in Canada. Newfoundland and Labrador, Alberta, Saskatchewan, Manitoba, and Yukon do not use either of the other practices at all. While several provinces practise selective harvest and commercial thinning to a small extent, only the Northwest Territories are not dominated by clear-cutting; most of the timber harvested in this territory is felled through selective harvest.
What contributes to sustainability?
Beyond considering the volume of timber harvest and the methods used for logging, the choice of forests to be logged also has a large impact on sustainability. Generally, forests are classified as either primary or secondary. Primary or “old-growth” forests exist in their natural undisturbed state and contain well-established ecosystems that have developed over a long time (perhaps hundreds or thousands of years, depending on the ecosystem). Secondary forests, on the other hand, are forests that have been recently harvested or otherwise disturbed (including naturally) and have since started to regrow but have not fully developed the characteristics of the primary forests that they replace.
Primary forests may have greater biodiversity than their secondary counterparts, and once lost, this biodiversity is more difficult to re-establish. Additionally, primary forests store and continue to sequester large quantities of carbon from the atmosphere, both in their vegetation and in their soil.5 From an environmental perspective, it is thus preferable to harvest trees from secondary forests, or forests planted by humans.
With its vast forest land, Canada is in a position to show leadership by preserving its old-growth forests. In the eastern United States and Europe, nearly all the primary forests have already been replaced by secondary forest as a result of intensive logging in the 19th century. Consequently, most logging in these regions now occurs in secondary forests. Canada, on the other hand, retains a huge amount of boreal forest—over 300 million hectares,6 most of which is primary forest. Canada thus is in a unique position to preserve its original forests, but it has been slow to step up to the challenge.
Recently, however, the B.C. government issued a ministerial order to protect much of the remaining old-growth forest in the Great Bear Rainforest along B.C.’s coast.7 Nationally, environmental organizations and forestry companies have also been working together to protect the boreal forest under the Canadian Boreal Forest Agreement since signing the agreement in 2010.
Canada also has the world’s largest area of forest certified to third-party sustainable forest certification. Forest certification ensures that harvested areas are reforested and that no unauthorized logging takes place. Certification also promotes sustainable forest management by ensuring the conservation of biological diversity and the maintenance of wildlife habitat, soils, and water resources, as well as the sustainability of timber harvesting.
The area of forests certified in Canada has steadily increased in recent years. By the end of 2014, Canada had 161 million hectares (of a total of 348 million hectares) certified to one of three programs: the Canadian Standards Association’s Sustainable Forest Management Standard, the Forest Stewardship Council (FSC) standards, and the Sustainable Forestry Initiative (SFI).8 Canada’s certified forests represent 43 per cent of all forest area certified globally—more than any other country worldwide.9
Footnotes
1 OECD, Environment at a Glance 2013, 44.
2 Some of the timber harvest in Alberta and B.C. in recent years is in response to an outbreak of the mountain pine beetle that started in the mid-2000s. This species, which kills and consumes pine trees, has long been observed in B.C., but has established itself in Alberta over the past decade since the outbreak began. Affected trees are burned to reduce the spread of the beetle, and some lumber is harvested prematurely to prevent economic loss.
3 Canadian Council of Forest Ministers, Growing Canada’s Forests (accessed July 13, 2015).
4 B.C. Ministry of Forests, Guidelines for Commercial Thinning, July 1999 (accessed July 13, 2015).
5 Sebastiaan Luyssaert et al., “Old-Growth Forests as Global Carbon Sinks,” Nature 455 (September 22, 2008) 213–215.
6 Natural Resources Canada, 8 Facts About Canada’s Boreal Forest.
7 British Columbia Ministry of Forests, Lands and Natural Resource Operations, Great Bear Rainforest Order.
8 Certification Canada, Provincial Statistics (accessed November 4, 2015).
9 Natural Resources Canada, Sustainable Forest Management in Canada: Key Facts (accessed Dec. 4, 2015).