
Sulphur Oxides Emissions
Key Messages
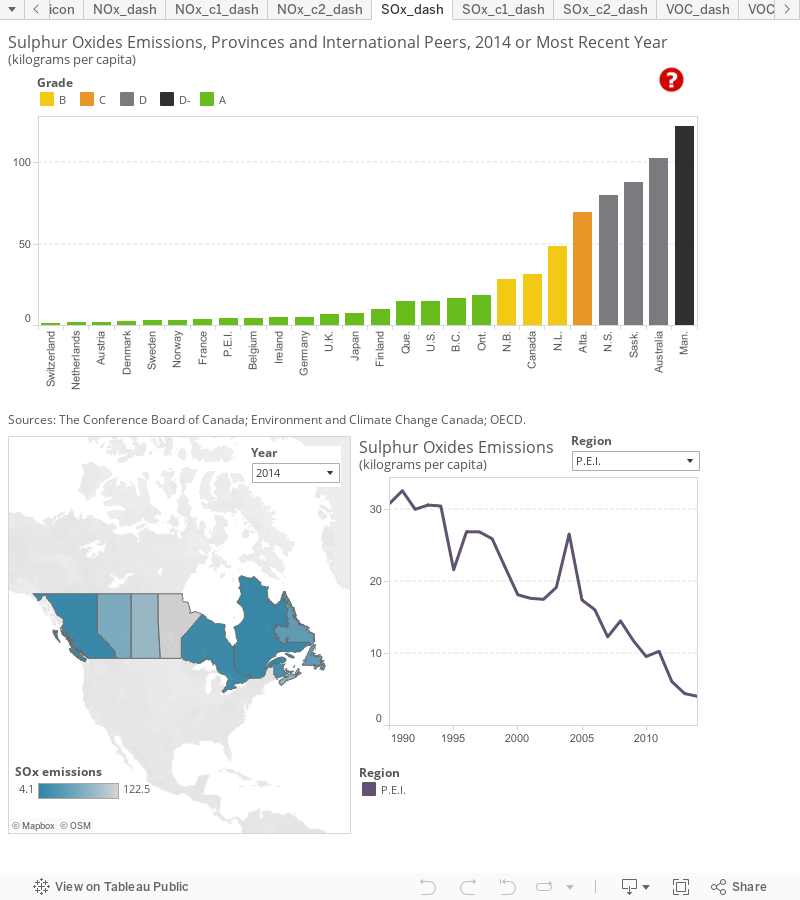
- P.E.I. is top-ranked among the provinces and scores an “A” grade, but ranks below seven of Canada’s peer countries.
- Manitoba has the highest sulphur oxides emission rate among all jurisdictions, giving the province a “D–” grade.
- Canada gets a “B” overall but ranks ahead of only one peer country, Australia.
Putting sulphur oxides emissions in context
Sulphur oxides (SOx) are emitted through the combustion of fossil fuels and other industrial processes, so sources include smelters, power plants, iron and steel mills, petroleum refineries, and pulp and paper mills. Smaller sources include residential, commercial, and industrial space heating. Sulphur oxides contribute to poor air quality and can directly harm human and animal respiratory systems, triggering respiratory illness and aggravating existing respiratory and cardiovascular diseases. They can also hurt aquatic ecosystems, buildings, crops, and forests.
Combined with nitrogen oxides, these gases react with other substances to form acid rain, fog, or snow. Acid precipitation damages vegetation, buildings, and materials, and it contributes to acidification of aquatic and terrestrial ecosystems.
Sulphur dioxide (SO2) can contribute to the secondary formation of fine particulate matter that is 2.5 micrometres or less in diameter (PM2.5), when it combines with other particles in the atmosphere to form sulphates. Particulate matter harms human health and the environment and contributes regional haze, which impairs visibility.
How do the provinces rank relative to Canada’s international peers?
Most of Canada’s provinces rank poorly on sulphur oxides emissions and are near the bottom of the pack relative to international peers. P.E.I., the top province, gets an “A” with SOx emissions of 4.1 kilograms per capita, comparable to the rates in France (3.7) and Belgium (4.3). While the province does score a high grade, P.E.I. still ranks behind seven of Canada’s peer countries. Switzerland has the lowest per capita SOx emissions: its rate of 1.4 kg per capita is roughly one-third of P.E.I.’s.
Three other provinces also receive “A” grades on SOx emissions: Quebec (14.9), B.C. (16.6), and Ontario (18.6) all produce less than 20 kg of SOx per capita, making them comparable to the U.S (15). Again, even though these provinces score “A”s, they don’t fare well relative to most international peers. In fact, among Canada’s 15 peer countries, only Australia does worse. Australia’s emission rate is 103 kg per capita—over five times the rate of Ontario.
Overall, Canada (31.6) scores a “B” grade, as do New Brunswick (28.5) and Newfoundland and Labrador (48.4). Alberta scores the only “C” grade, with an emission rate of 69.3 kg per capita. Nova Scotia (79.9) and Saskatchewan (88.2) earn “D” grades with emission rates between 80 and 90 kg per capita.
Manitoba gets a dismal “D–” grade and ranks at the very bottom with an emission rate of 122.5 kg of SOx per capita.
How do the provinces perform relative to each other?
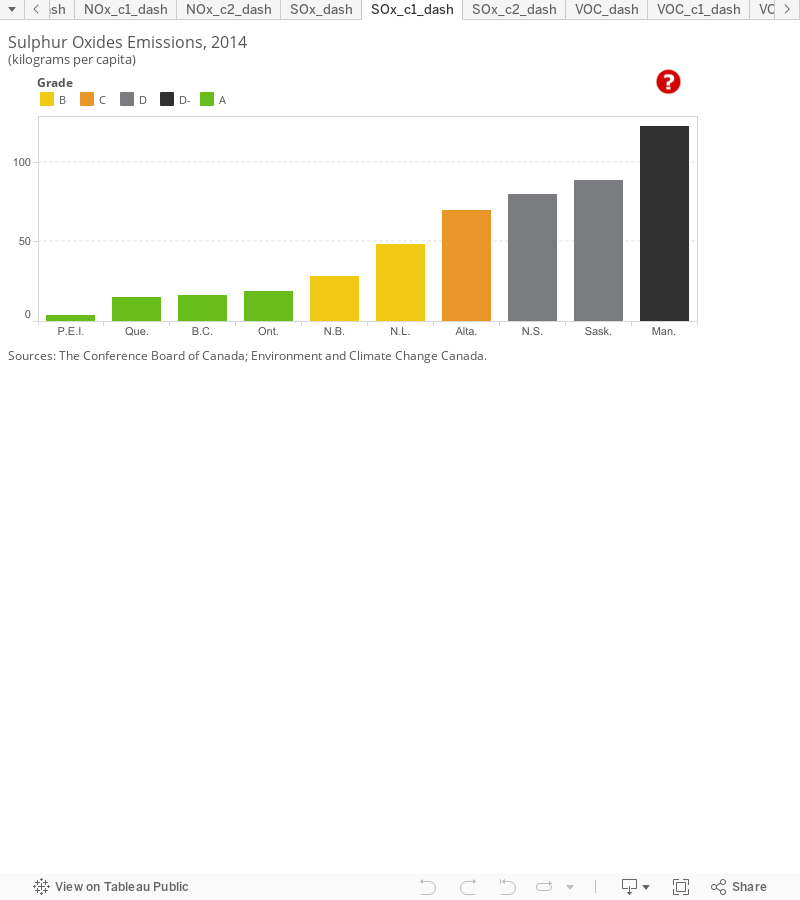
P.E.I. is, by a wide margin, the lowest emitter of SOx, with an emission rate of only 4 kg per capita. Quebec, B.C., and Ontario also have relatively low SOx emissions—yet these provinces’ rates of 15 to 20 kg per capita are 4 to 5 times the rate in P.E.I.
New Brunswick and Newfoundland and Labrador rank in the middle of the pack, with emission rates roughly 8 to 12 times the rate of P.E.I.
Alberta, Nova Scotia, and Saskatchewan do poorly, with emission rates between 70 and 90 kg per capita.
Manitoba is the worst-rated province, with an emission rate just over 122 kg of SOx per capita—roughly 30 times that of P.E.I.
How do the territories fare on sulphur oxides emissions?
Yukon has a very low sulphur oxides emission rate. The territory emits only 1 kg of SOx per capita and is an “A+” performer, with the lowest emission rate among all the regions. This low emission rate is predominantly a result of decreasing natural gas production in the territory. Prior to 2013, the upstream petroleum industry generated over 95 per cent of Yukon’s SOx emissions. However, production of natural gas ceased in 2012, and since then, Yukon’s SOx emissions have been extremely low.
The Northwest Territories and Nunavut also fare well, with “A” grades for emission rates of 18 and 24 kg per capita, respectively.
The territories are not included in the overall provincial and international benchmarking calculations because data for each individual territory were not available for several of the indicators included in the overall environment report card. The Conference Board is, however, committed to including the territories in our analysis, and so we provide information on territorial performance when data are available.
How has the performance of Canada and the provinces changed over time?
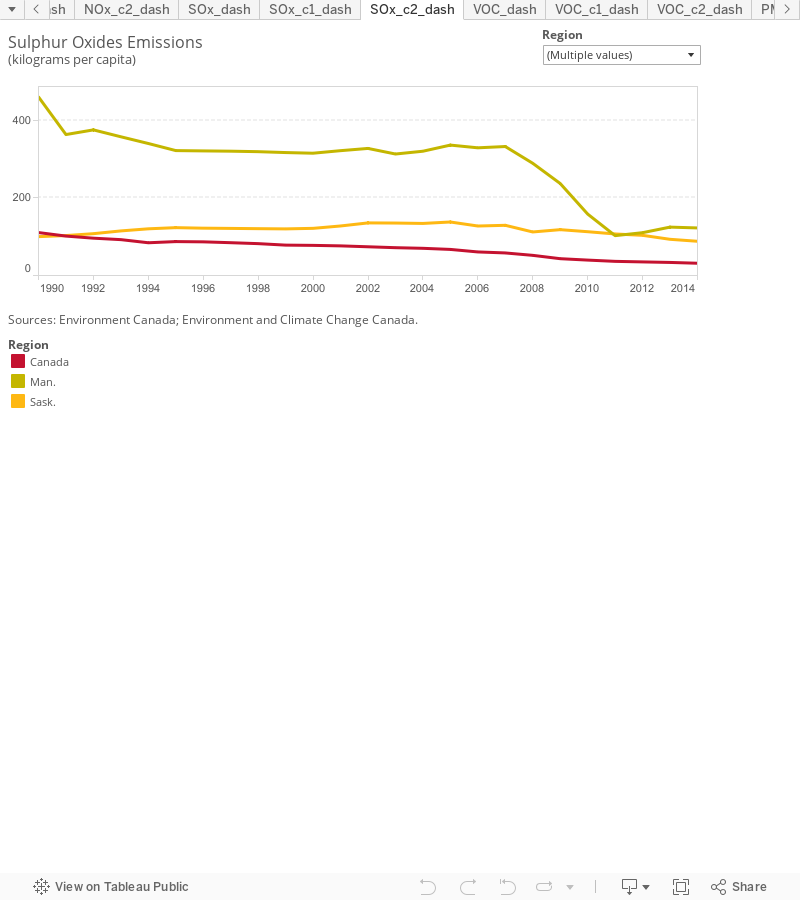
Since 1990, Canada’s per capita SOx emissions have dropped by 71 per cent, from 111 kg to 32 kg in 2014. Most provinces have reduced per capita SOx emissions by at least 50 per cent. The only exception is Saskatchewan, which has seen reductions of only 11 per cent since 1990.
In most provinces, reductions to emission rates have been steady and gradual, with a couple of exceptions. Manitoba stands out, as its per capita SOx emissions in the early 1990s were well above those of any other province. Between 2007 and 2011, Manitoba made huge cutbacks in SOx emissions, a result of decreased emissions from its smelting and refining industry. Despite these cutbacks, this industry still produces the vast majority of Manitoba’s SOx emissions, which have increased by over 20 per cent in absolute terms from their 2011 low.
Where should Canada’s provinces look for a role model?
While P.E.I. performs well, most Canadian provinces fall behind almost all international peers, and could reduce SOx emissions substantially.
The European peer countries have long outperformed both Canada and the U.S. on reductions in SOx emissions. Like Canada, the U.S. has reduced its per capita emissions by less than most of it peers.
The Europeans have shown that substantial reductions in sulphur oxides are possible over a relatively short time period. In 1990, for example, both Germany and the U.K. had annual SOx emissions that exceeded Canada’s by significant amounts. By 2012, however, both countries had reduced their emissions to levels well below that of Canada, and their per capita emission intensities were lower than those of all provinces except P.E.I.
In Germany, old combustion facilities were replaced with new ones that use improved technology. Germany also regulated desulphurization of flue (exhaust) gases emitted by large combustion plants in the eastern part of the country, and switched from coal, which has a high sulphur content, to gaseous and liquid fuels that contain less sulphur.
The result? Germany decreased its SOx emissions by over 90 per cent (in absolute terms) between 1990 and 2012.1
This decrease occurred despite the fact that two-thirds of Germany’s electricity is generated by the combustion of fossil fuels.2
This indicates that SOx emissions can be dramatically reduced even in provinces that rely heavily on combustion for electricity generation.
Recent action in Canada should help to further decrease SOx emission rates. In 2012, the Canadian Council of Ministers of the Environment (an intergovernmental council that facilitates cross-jurisdictional environmental action across the territorial, provincial, and federal governments), with the exception of Quebec, agreed to implement a nationwide air quality management system—a set of guidelines for monitoring emissions and setting emissions standards. The system contains air quality standards—set out in the Canadian Ambient Air Quality Standards (CAAQS)—for fine particulate matter (PM2.5) and ozone. Standards for nitrogen dioxide (NO2) and sulphur dioxide (SO2) are being established. The air quality management system also defines air zones (within provinces and territories) and regional airsheds (across provincial and territorial boundaries) to guide cross-jurisdictional cooperation to achieve the CAAQS. Further, it establishes base-level industrial emission requirements to unify emissions standards for industry in Canada and requires that ambient air quality and emissions data be publicly available.
Footnotes
1 OECD, OECD Stats: Emissions of Air Pollutants (accessed July 9, 2015).
2 International Energy Agency, Monthly Electricity Statistics (accessed July 9, 2015).