
PM10 Emissions
Key Messages
- Ontario, Manitoba, and B.C. are the top-ranking provinces, ranking 11th, 15th, and 16th, respectively, among 24 comparator regions, and scoring “C” (Ontario) and “D” (Manitoba and B.C.) grades.
- All other provinces score “D–” grades, ranking at the bottom of the pack.
- Canada as a whole receives a “D” and has the highest per capita PM10 emissions among all peer countries.
Putting particulate matter in context
Particulate matter (PM) is one of many pollutants that contribute to reduced air quality in Canada. Atmospheric PM is caused by both human activities (e.g., the combustion of fossil fuels) and natural occurrences (e.g., wildfires).
Exposure to these particles can cause a range of health problems, including aggravated cardiac and respiratory diseases such as asthma, bronchitis, emphysema, and various forms of heart disease.1 Children, the elderly, and people with respiratory disorders are particularly susceptible. Other toxic air pollutants can bind to the PM that is already in the air, creating additional health risks. PM exposure is a hazard for urban and rural Canadians and can affect any region of Canada year-round.
PM can also harm vegetation, materials, and buildings. When PM is deposited on metals, wood, stone, painted surfaces, and fabrics, it may cause soiling and discoloration, in addition to physical and chemical degradation of these materials. PM may also leach into soils and increase their pH values, and accumulate on the surfaces of plants, affecting their ability to photosynthesize.2
PM, along with other air pollutants, contributes to reduced visibility and regional haze.3
PM emissions are measured on a per capita basis, but exclude “open sources” of PM emissions—that is, diffuse sources emitted over large geographical areas, such as dust from roads and forest fires.4 Open sources are responsible for most of Canada’s PM emissions, but international data for open source emissions are not widely available for comparison. Instead, this report card measures PM emissions only from sources such as industry and home firewood burning.
What creates atmospheric particulate matter?
A considerable proportion of PM concentration is the result of human activities, including mineral dust due to mining; windblown agricultural soil; volatile organic compounds (VOCs) from vehicles, industrial processes, and solvents; sulphates and nitrates from power plants and transportation sources; and road and construction dust.5 Natural emissions of PM include wildfires, windblown dust, sea salt spray, some mineral particles, natural nitrogen oxide (NOx), and some VOC emissions produced by plants, animals, and fungi.
PM10 refers to particulate matter that is 10 micrometres or less in diameter. PM10 is generally subdivided into fine particles 2.5 micrometres or less (PM2.5) and coarse particles larger than 2.5 micrometres.
The larger particles are referred to as “inhalable coarse particles” and are found near roads and industries that produce a lot of dust, such as agriculture and mining.
PM2.5 are “fine particles” found in smoke and haze and can be directly emitted from sources such as forest fires. They also form when gases emitted from power plants, industries, and automobiles react in the air.6
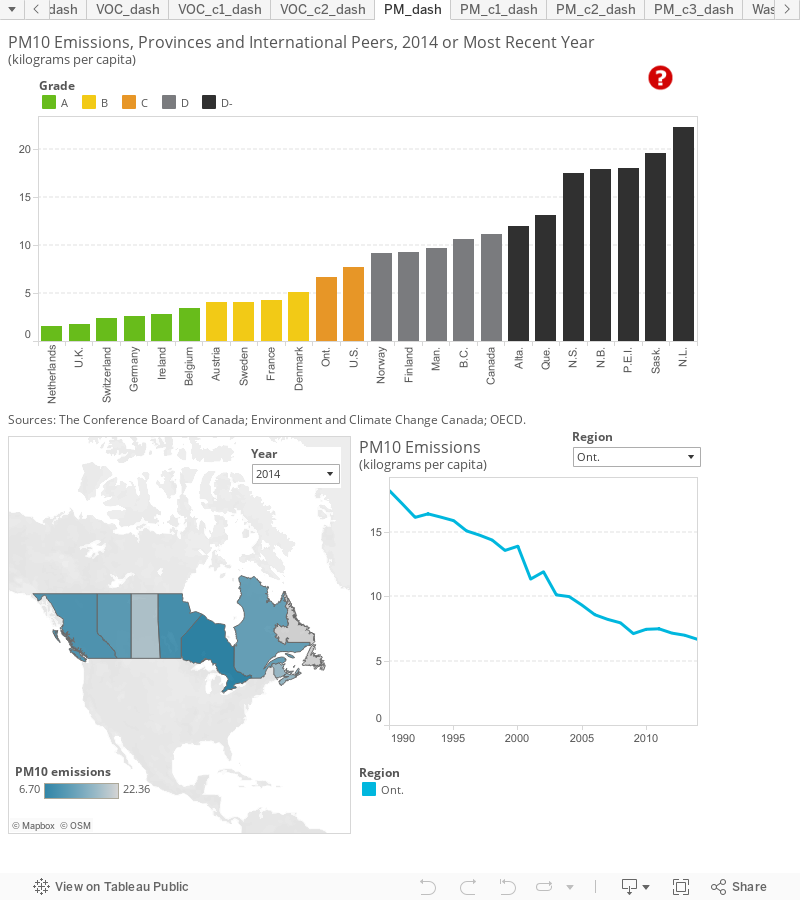
How do the provinces rank relative to Canada’s international peers?
Canada and its provinces get low grades, with most provinces ranking behind all international peers. With PM10 emissions of less than 11 kg per capita, Ontario (6.7), Manitoba (9.7) and B.C. (10.7) are the only provinces with PM10 emission rates below the national average (11.2), but score only a “C” and “D”s, respectively. These provinces have emission rates comparable to the U.S. (7.7), Norway (9.2), and Finland (9.2) but higher than those of France (4.3) and Denmark (5.1), which rank 9th and 10th, respectively. Ontario’s per capita emission rate is over four times higher than that of the Netherlands (1.6), the top-ranked jurisdiction.
Most provinces get “D–” grades with emission rates ranging from 12 kg per capita in Alberta to 22.4 kg per capita in Newfoundland and Labrador, which ranks lowest among all comparator jurisdictions.
As a whole, Canada gets a “D” and ranks last among 14 peer countries (no data are available for Japan or Australia).
How do the provinces perform relative to each other?
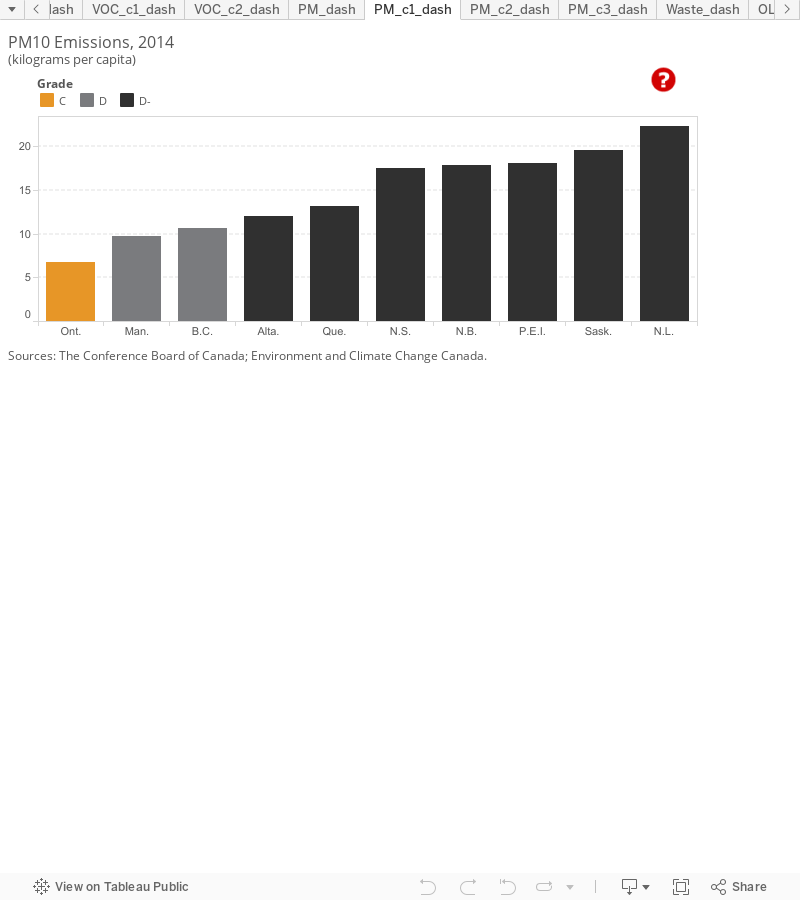
The top-ranked provinces are Ontario and Manitoba, which have per capita PM10 emission rates below 10 kg per capita. British Columbia is not far behind, with an emission rate of 10.7 kg per capita.
While most provinces get “D–” grades, there is a relatively wide range in per capita emission rates. Alberta (12) and Quebec (13.1) have emission rates under 15 kg per capita, while Nova Scotia (17.5), New Brunswick (17.9), P.E.I. (18.1), and Saskatchewan (19.6) have emission rates ranging between roughly 18 and 20 kg per capita.
Newfoundland and Labrador has the highest per capita emission rate. The province emits 22.4 kg of PM10 per capita—over three times the rate in Ontario.
How do the territories fare on PM10 emissions?
The territories exhibit a range of PM10 emission rates. Yukon performs very well. With only 4.4 kg per capita, the territory scores a “B” grade and ranks above Ontario, the top-ranked province. Nunavut and the Northwest Territories, on the other hand, have high emission rates (12.6 and 14. kg per capita respectively) and both score “D–” grades. However, despite the low grades, these territories perform better on this indicator than half of the provinces.
The territories are not included in the overall provincial and international benchmarking calculations because data for each individual territory were not available for several of the indicators included in the overall environment report card. The Conference Board is, however, committed to including the territories in our analysis, and so we provide information on territorial performance when data are available.
How have Canada’s PM10 emissions changed over time?
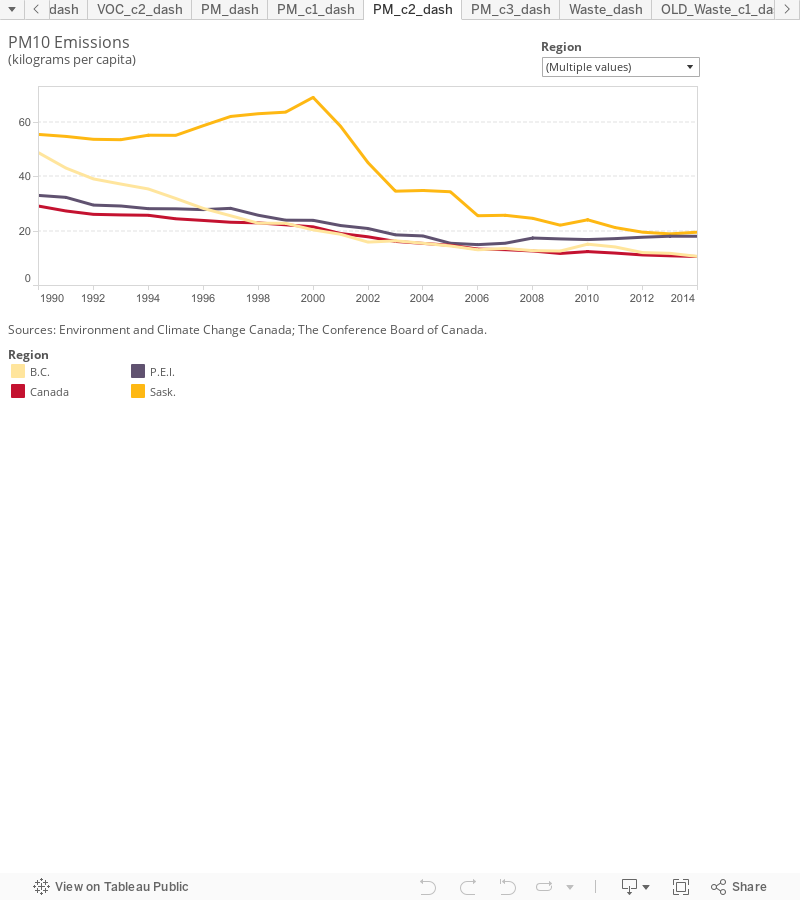
Nationally, the emission rate of PM10 has dropped substantially, from 29 kg per capita in 1990 to 11 kg per capita in 2014—a reduction of over 60 per cent. Most provinces have reduced their emission rates steadily and substantially. The biggest improvement has been in B.C., which decreased emissions from 49 to 11 kg per capita (a 78 per cent reduction). The smallest reduction was made by P.E.I., which lowered per capita emissions from 33 to 18 kg per capita (45 per cent).
Saskatchewan is the exception, however. The province’s PM10 emission rates increased substantially between 1993 and 2000, as emissions from electricity generation grew quickly. Subsequently, though, emission rates dropped quickly, as emissions from both electricity generation and the grain industry rapidly decreased. By 2014, Saskatchewan had reduced its per capita PM10 emissions 65 per cent below 1990 levels, comparable to the national average reduction.
What are the main sources of particulate matter in Canada?
About 95 per cent of the PM10 generated in Canada comes from open sources (not included in the international comparisons).7 Of these, nearly half are produced as dust from roads (both paved and unpaved). Construction contributes another 32 per cent, and agriculture another 19 per cent.
The breakdown of closed-source PM10 emissions varies across the provinces, but most emissions in Canada can be attributed to these three sources:
- residential wood fuel combustion (43 per cent)
- industrial sources (36 per cent): mining and rock quarrying (10 per cent), grain industries (4.3 per cent), cement and concrete industry (3.8 per cent), pulp and paper industries (3.3 per cent), and the upstream petroleum industry (3.0 per cent)
- transportation (15.3 per cent): off-road vehicles (6.2 per cent), heavy-duty vehicles (2.9 per cent), and marine transportation (1.7 per cent)
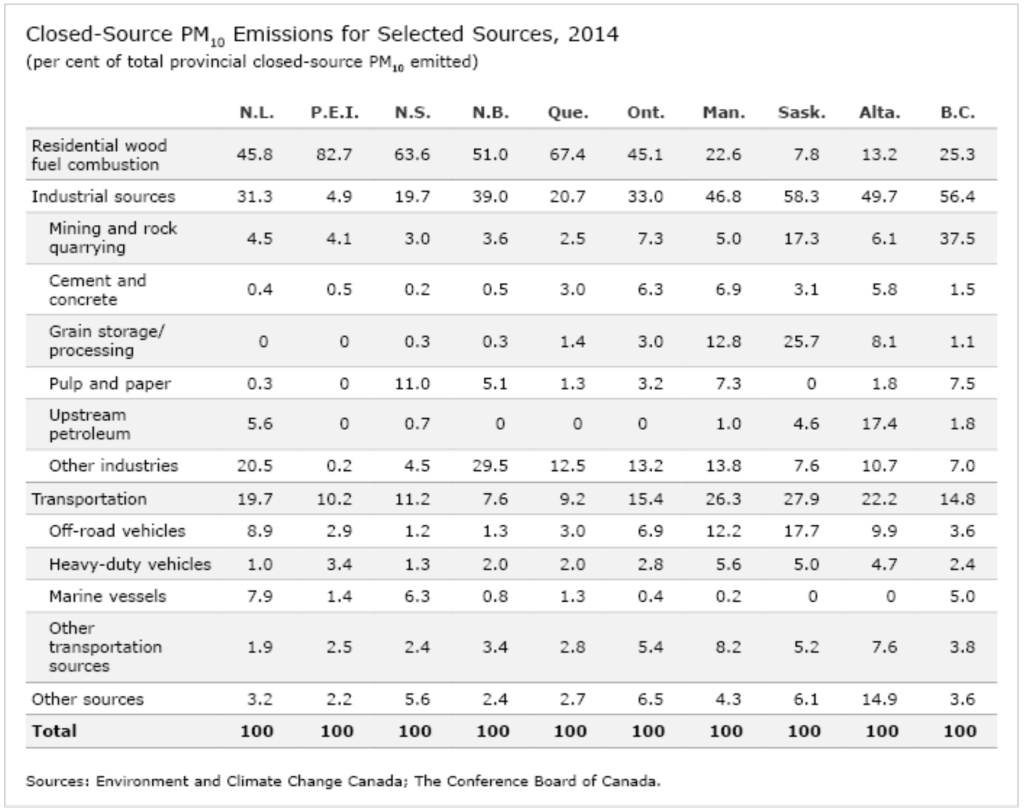
There are, however, some clear distinctions among the provinces. P.E.I., for example, produces far fewer PM10 emissions from industry than is typical of other provinces—only 5 per cent. Most PM10 emissions in P.E.I. come from the combustion of residential wood fuel (83 per cent)—much more than in any other province.
The opposite is true in Saskatchewan. Only 8 per cent of its PM10 emissions are from residential wood combustion, and over 58 per cent of PM10 is emitted by industry (a higher proportion than all provinces other than B.C.). Over 40 per cent of the emissions from this sector come from the grain industry. Saskatchewan also has the highest share of PM10 emissions from transportation, at 28 per cent.
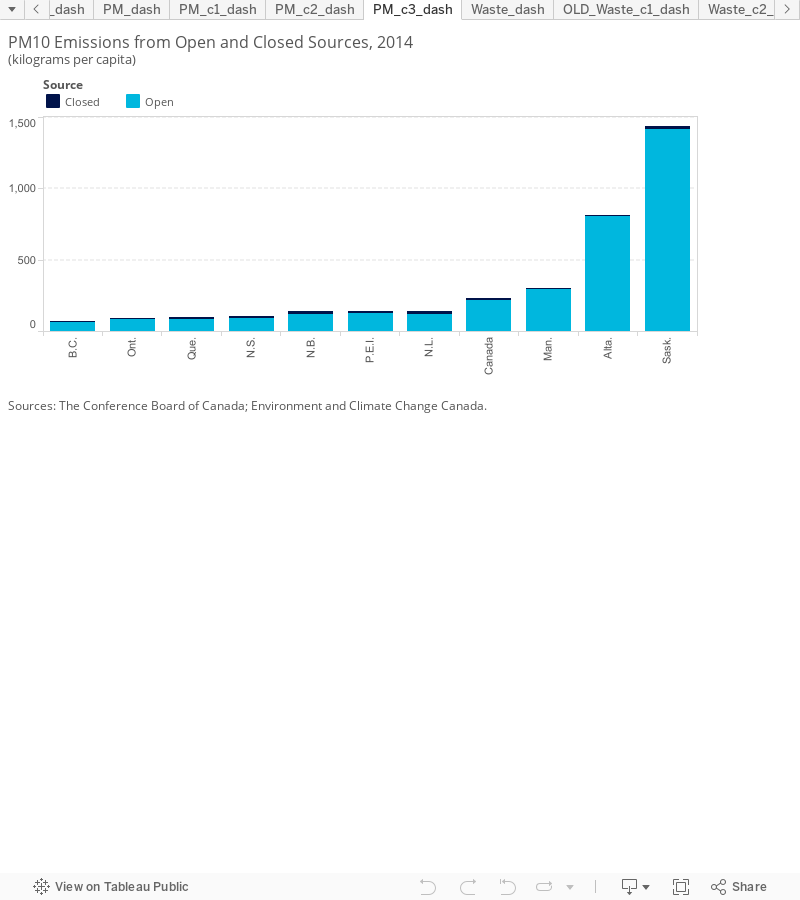
If we include the open sources of PM10 emissions, we see some notable changes to the provincial rankings. The three Prairie provinces drop to the bottom of the pack. These provinces have high emissions of dust from unpaved roads and from agriculture. Alberta and Saskatchewan also have extremely high PM10 emissions resulting from construction. While dust emissions from agriculture are on the decline, dust from unpaved roads and emissions from construction are increasing in all three Prairie provinces. Meanwhile, including open sources of emissions moves B.C. up from a middle-of-the-pack performer to the best-ranked province. Ontario remains high in the rankings.
What is Canada doing to reduce particulate matter emissions?
Canada made substantive progress between 1990 and 2014 in reducing the rate at which it emits particulate matter. However, its per capita emissions are still higher than the rates of all other peer countries in our analysis, so there is still room for improvement.
In 2012, the Canadian Council of Ministers of the Environment (an intergovernmental council that facilitates cross-jurisdictional environmental action across the territorial, provincial, and federal governments), with the exception of Quebec, agreed to implement a nationwide air quality management system—a set of guidelines for monitoring emissions and setting emissions standards. The system contains air quality standards—set out in the Canadian Ambient Air Quality Standards (CAAQS)—for fine particulate matter (PM2.5) and ozone.
In June 2014, the Government of Canada proposed new mandatory emission regulations that would apply to industry, called the Multi-Sector Air Pollutants Regulations. If these regulations are adopted and phased in over time as planned, the resulting reduction in PM2.5 emissions (relative to a business-as-usual scenario) could save Canadians $3.8 billion (in 2012 constant dollars) in health costs between 2013 and 2035.8 These emission regulations pertain only to closed sources of emissions, so they are unlikely to have an impact on the largest sources of particulate matter emissions in Canada—namely, dust kicked up from roads and created during construction.
Footnotes
1 Environment and Climate Change Canada, Particulate Matter (accessed March 22, 2016).
2 Friday et al., “Ecological Effects of Particulate Matter on the Histochemical Content of Alchonea cordifolia, Musa pradisiaca, and Manihot esculenta,” International Journal of Scientific & Technology Research 3 no. 389.
3 U.S. Environmental Protection Agency, Visibility: Basic Information (accessed July 13, 2015).
4 Environment and Climate Change Canada, Glossary.
5 Caitlin Hancey, Particulate Matter, Ground-Level Ozone, and the Canada-Wide Standards Regulatory Process, (Ottawa: Sierra Club, December 1999), (accessed August 19, 2008).
6 U.S. Environmental Protection Agency, Particulate Matter, March 18, 2013 (accessed July 13, 2015).
7 Calculated using data from Environment Canada, Air Pollutant Emission Inventory, May 1, 2015 (accessed July 13, 2015).
8 Canada Gazette, Multi-Sector Air Pollutants Regulations. The estimated saving in health costs is the sum of the health benefits of reduced PM2.5 emissions from engines, boilers, and heaters used by industry and cement manufacturing facilities. See tables 10, 20, and 25.