
Equity in Learning Outcomes
Key Messages
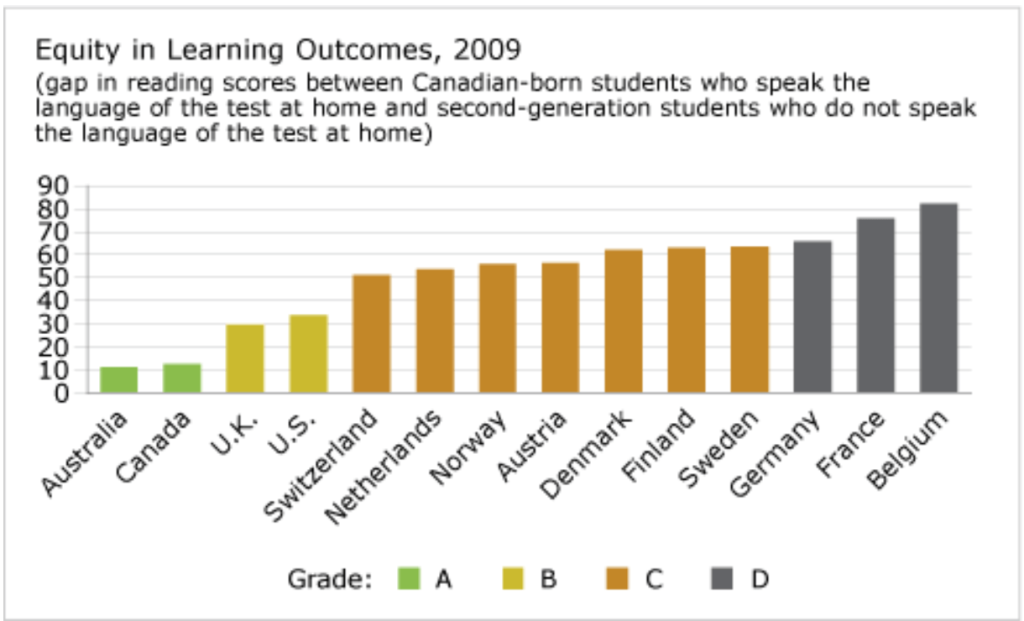
- Canada gets an “A” and ranks 2nd out of 14 peer countries.
- There is only a small gap between the overall reading scores of Canadian-born students who speak the language of the test at home and the scores of Canadian-born second-generation students who do not.
- In an immigrant society like Canada’s, it is critical to ensure that the children of immigrants have opportunities and life chances equal to the children of Canadian-born parents.
Putting Canada’s equity in learning outcomes in context
The grand promise of public education is to provide all students with an equal opportunity to learn and prepare themselves for work or future education regardless of their socio-economic conditions at home. In an immigrant society like Canada’s, this ambition is critically important to ensure that the children of immigrants have opportunities and life chances equal to the children of Canadian-born parents. Canadian education appears to be delivering on this promise, though there is room for improvement.
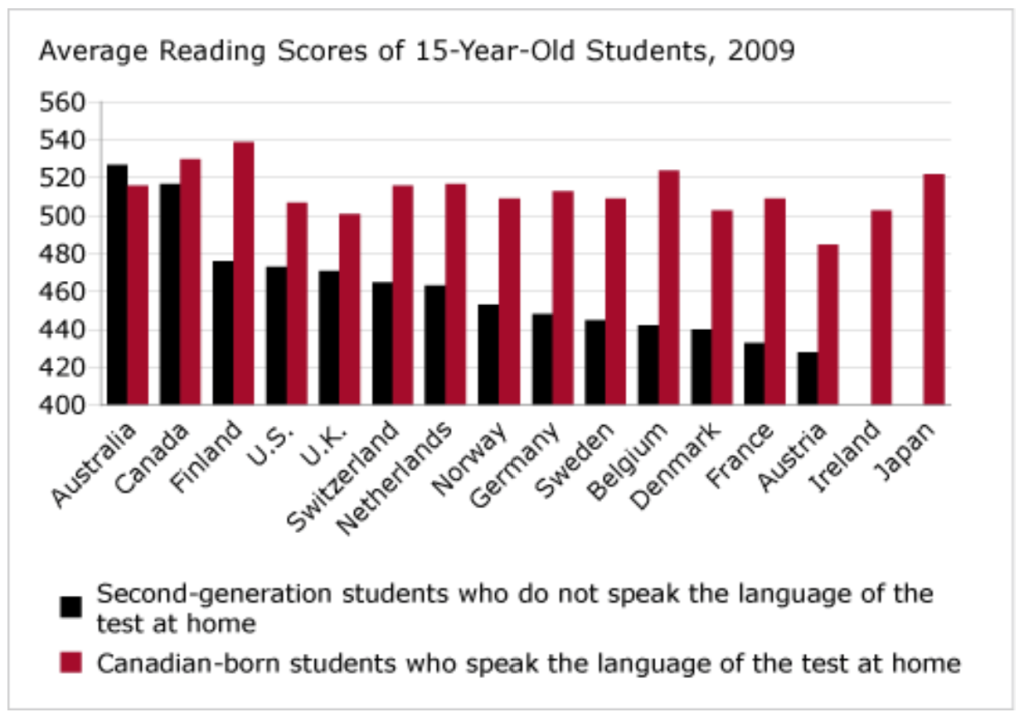
There is only a small difference between the overall reading scores of Canadian-born students who speak the language of the test (i.e., English or French) at home and the scores of Canadian-born second-generation students who do not speak the language of the test at home. While those who speak the test language at home achieved a score of 530, second-generation students who do not speak the language were close behind with a score of 517—a difference of less than 3 per cent.
The reading test used for this report card is from the Programme for International Student Assessment (PISA), an international assessment of the skills and knowledge of 15 year olds, coordinated by the Organisation for Economic Co-operation and Development (OECD).
How does Canada’s performance on the indicator measuring equity in learning outcomes compare to those of its peer countries?
Canada performs much better than almost all of its peer countries on equity in learning outcomes. Although it trails Australia—whose second-generation students actually do better than its others students—the gap in reading test scores in Canada (12.9 points) is less than half the gap in its next closest competitors, the U.K. (30 points). Moreover, Canada’s gap is well below the average gap of its peers of 51 points.
Remarkably, not only is the gap in reading test scores smaller in Canada than almost every other peer country, but the average score of the Canadian students who do not speak the language of the test at home is actually higher than the scores of students who speak the language of the test at home in 11 of the 16 peer countries. In other words, in addition to doing well in educational equity, the Canadian system produces outcomes for immigrants’ children that are among the world’s best regardless of immigration status. This means Canadian students are operating on an almost equal playing field domestically, and are being prepared to compete for other educational and employment opportunities globally.
Which countries perform the best on the indicator measuring equity in learning outcomes?
Australia leads its peers in ensuring equity in learning outcomes, showing a gap of only 11.2 points on reading test scores. What’s fascinating about the Australian situation is that second-generation students who do not speak the test language at home are achieving better scores, on average, than Australian students who speak the test language at home. This could be a consequence of an immigration system that selects highly educated candidates who, in turn, may provide a strong foundation for their children’s educational performance, regardless of the language spoken at home. Indeed, this might also partly explain Canada’s superior performance.
Nevertheless, because second-generation students are testing well in a language other than their home language, it is clear that the Australian and Canadian education systems are making a contribution to equity.