
Unemployment Rate
Key Messages
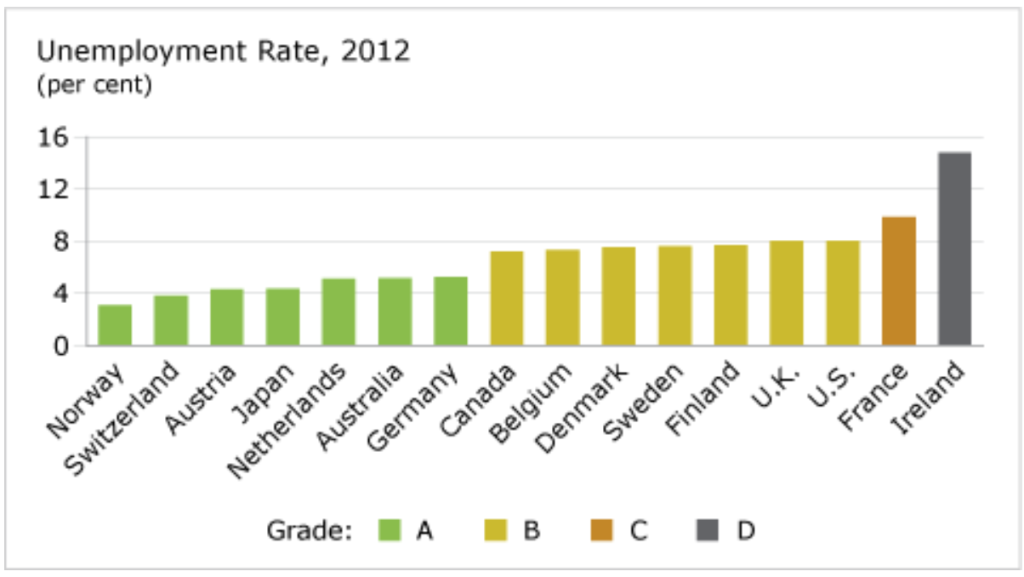
- Canada achieves a “B” grade, ranking in 8th place out of 16 peer countries.
- The unemployment rate in Ireland remains sharply elevated, a legacy of the 2008–09 financial crisis and the bursting of its housing bubble.
- France also has a growing unemployment problem, receiving the lone “C” grade and ranking 15th.
Putting the unemployment rate in context
Canada’s unemployment rate in 2012 had declined from the recent 8.3 per cent peak during the 2009 recession. Moreover, mass unemployment has become less of a national priority. In 1983, the unemployment rate in Canada reached an all-time high of 12 per cent. A more robust economy following the recession in the early 1990s, as well as a tightening of the rules for employment insurance claims, helped Canada to cut that rate in half. It reached a 32-year low in 2007.
High unemployment tends to hurt growth in labour productivity and gross domestic product (GDP). It is also linked to higher rates of poverty, homelessness, income inequality, crime, poorer health outcomes, lower self-esteem, and social exclusion.
How is the tepid economic recovery affecting unemployment?
Unemployment rates rose in all comparator countries, including Canada, during the 2009 global economic recession. The biggest jump in unemployment was in Ireland, where the rate effectively doubled, from 6 per cent in 2008 to 11.8 per cent in 2009. Ireland’s unemployment rate continued to rise, hitting 14.8 per cent in 2012. Unemployment also rose sharply in the United States—from 5.8 per cent in 2008 to 9.3 per cent in 2009. The U.S. shed nearly 8 million jobs in 2008 and 2009, primarily in manufacturing and construction.
The situation in the U.S. has been slow to turn around, with unemployment still hovering above 8 per cent in 2012—not including the unemployed who are no longer searching for as job, and are therefore not counted in the labour force survey. Most other comparator countries have seen their unemployment rates decline since the 2009 recession, although Denmark, France, Ireland, the Netherlands, and the U.K. had a higher unemployment rate in 2012 than in 2009, indicating the ongoing fragility of these economies, largely because of the financial turmoil in the heavily indebted European Union countries like Greece, Italy, and Spain.
Should Canada aim for zero unemployment?
The aim should be that every Canadian who wants to work and is able to work should be able to find a job. Unemployment, especially on a repeated or prolonged basis, has disturbing consequences for individuals, their families, and the communities in which they live.
But “full employment” in economic terms does not necessary mean zero unemployment. Rather, it is the lowest possible unemployment rate with the economy growing and all factors of production being used as efficiently as possible. There will always be unemployment caused by mobility within the labour force—people moving between jobs, switching careers, or relocating geographically. Structural shifts in the economy—often the result of technological change—also contribute to some level of unemployment. When, for example, the introduction of computer desktop publishing led to the elimination of traditional typesetting, typesetters lost their jobs. Some were able to retrain for other jobs, but others found themselves unemployed. The only way a country could ever eliminate this type of unemployment is by eliminating all technological advancement that results in structural shifts. Obviously, no country should aspire to this.
Does low unemployment ensure a stronger economy?
Not necessarily. Countries with extremely low unemployment rates often face labour shortages. A 2007 study by the Norwegian Labour and Welfare Organization found that about 44 per cent of Norwegian enterprises were struggling to hire staff at that time. One in every four Norwegian enterprises was badly in need of more workers. Labour shortages can severely constrain economic growth and potential.
Why is Norway a special case?
Norway has the highest GDP per capita, the lowest unemployment rate, and one of the lowest average hours worked per week of the 16 peer countries. The low unemployment rate is due to demographic factors (even creating labour shortages for some skills) and the economy performing near its full potential.
Shorter working hours are often a positive by-product of rising income (or GDP) per capita. In short, as people have more money, they choose to work less and enjoy more leisure time. Reducing hours worked can create jobs for other people, helping to bring down the unemployment rate. Norwegians work 27.1 hours per week, while Canadians work an average of 32.9 hours per week.
Has Canada ever been a class leader?
No. Despite the recent decline in unemployment, Canada has not improved its position very much relative to most of the other 16 peer countries, which have also reduced their unemployment rates over the past four decades.
In absolute terms, Canada’s unemployment rate is considerably lower today than it was 30 years ago. Unemployment reached a high of 12 per cent in 1983. By 2008, the unemployment rate was 6.2 per cent, and in 2012 it was 7.2 per cent.
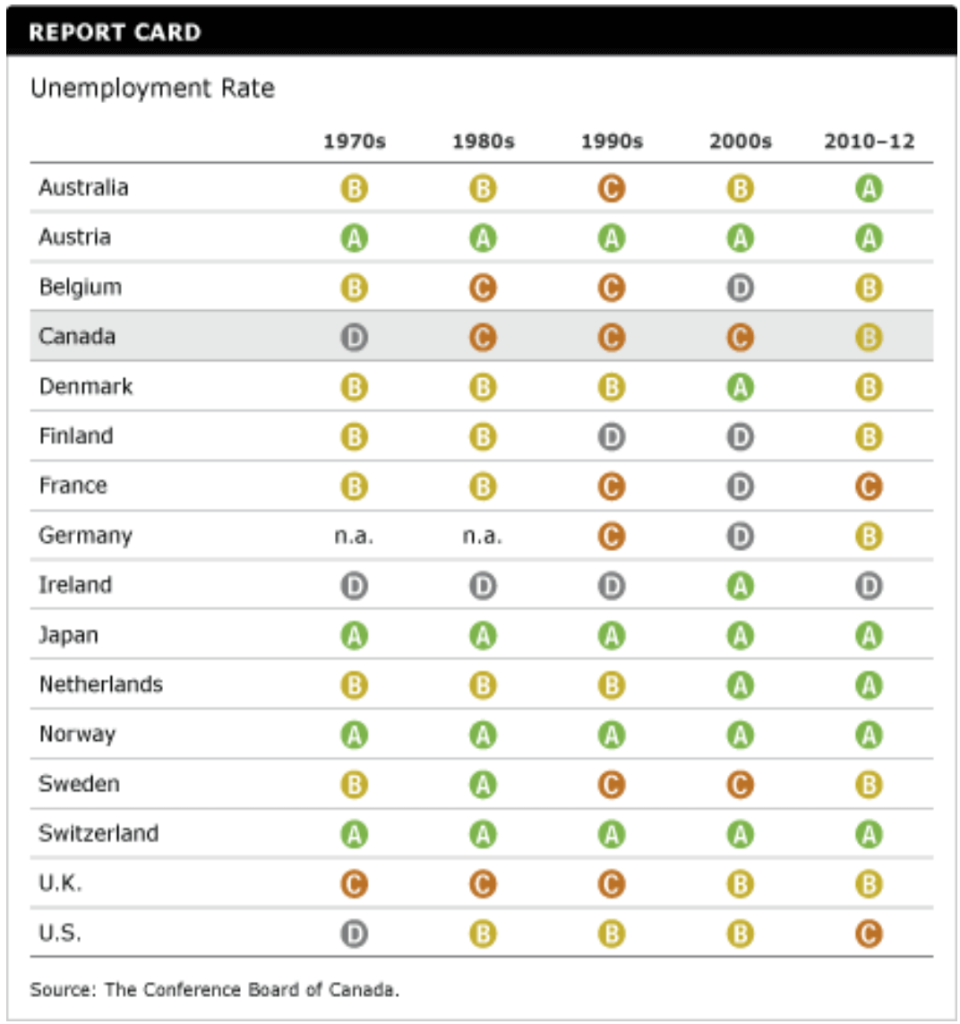
Why did Sweden and Finland’s grades deteriorate?
Sweden and Finland suffered a significant grade drop in this category in the 1990s and 2000s. Sweden went from an “A” in the 1980s to a “C” in the 1990s and 2000s. Finland fell from a “B” in the 1970s and 1980s to a “D” in the 1990s and 2000s. Both Finland and Sweden began the 1970s with unemployment rates below 2 per cent, but now have an unemployment rate around 7.7 per cent.
Finland went through a deep depression in the 1990s—partly due to the collapse of trade with the Soviet Union in 1991—during which unemployment rose from 4.5 per cent in 1990 to 17.9 per cent in 1994, the highest of any of the comparator countries in four decades. Sweden had a similar story. Between 1990 and 1993, GDP fell by a total of 4.3 per cent, causing the worst economic crisis in Sweden since the 1930s, and unemployment soared.
Why was Canada’s unemployment rate persistently higher than the U.S. rate for 30 years?
For a brief time in the mid-1970s, unemployment in the U.S. was higher than in Canada, largely a result of the more severe effects of the 1974–75 recession in the United States. By 1981, however, unemployment rates in the two countries were identical, at 7.6 per cent. But the parity would not last long.
Canada was hit hard by the economic downturn of 1981–82. Although overall GDP growth in the 1980s was nearly identical in the two countries and both economies rebounded by the end of the decade, Canada experienced a simultaneous growth of its labour force, increasing the number of people available to work. Mostly this was due to higher participation of women in the workforce, as a result of the coming of age of Canada’s baby boomers, as well as an influx of immigrants. Canada’s inability to accommodate the larger labour force triggered an unemployment gap with the U.S., one that would carry Canada into the next decade.
The 1990s began with a recession that was much more severely felt in Canada than in the United States. The gap in unemployment, which averaged 2.8 percentage points in the 1980s, widened to 3.8 percentage points in 1993. The recovery that followed has sometimes been referred to as a “jobless recovery” in Canada. Employment was slow to rebound, despite growth in output. By the end of the decade, however, employment growth in Canada was substantially higher than in the United States. Sluggish economic conditions in the U.S. in the 2000s reduced and overturned the gap. Canada’s unemployment rate has been lower than the U.S. rate since 2009.