
Inward FDI Performance
Key Messages
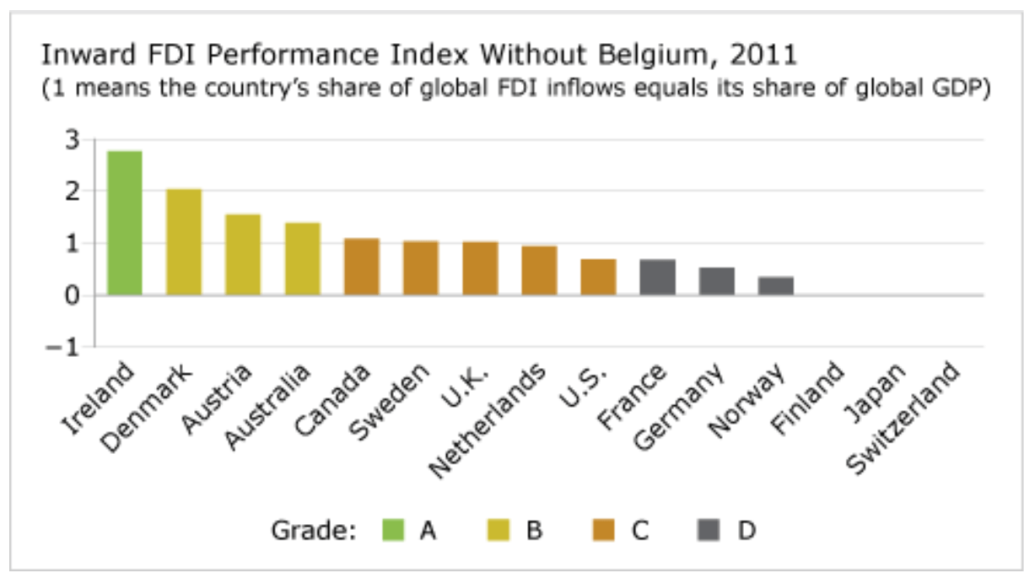
- Canada ranks 6th out of 16 peer countries on the Inward FDI Performance Index in 2011, but earns only a “D” grade because Belgium’s exceptionally high score distorts the comparative results.
- If Belgium were removed from the comparator group, Canada would move up one grade to a “C.”
- Over the past four decades, Canada’s ranking on this indicator has steadily dropped, reflecting the end of the “branch plant” FDI model, under which high tariffs on manufactured goods encouraged FDI as a substitute for international trade.

What is FDI?
The International Monetary Fund defines foreign direct investment (FDI) as an investment that allows an investor to have a significant voice in the management of an enterprise operating outside the investor’s own country. The phrase “significant voice” usually means ownership of 10 per cent or more of the ordinary shares or voting power (for an incorporated enterprise) or the equivalent (for an unincorporated enterprise). This may involve either creating an entirely new enterprise—a so-called greenfield investment—or, more typically, changing the ownership of existing enterprises, via mergers and acquisitions. Other types of financial transactions between related enterprises, such as reinvesting the earnings of the FDI enterprise, are also defined as FDI.
What is the Inward FDI Performance Index?
The Inward FDI Performance Index captures a country’s relative success in attracting global FDI. If a country’s share of global inward FDI matches its relative share in global GDP, the country’s Inward FDI Performance Index is equal to one. A value greater than one indicates a larger share of FDI relative to GDP; a value less than one indicates a smaller share of FDI relative to GDP. A negative value means foreign investors disinvested in that period.
What is Canada’s ranking on the Inward FDI Performance Index?
Canada ranks 6th out of 16 countries on inward FDI in 2011, but earns only a “D” grade. Canada attracted 2.7 per cent of the world’s FDI in 2011 and accounted for 2.5 per cent of world GDP. Eight peer countries, including Canada, have an Inward FDI Performance Index that is greater than one, meaning that all these countries attract more inward FDI than their economic size would suggest. Although an index result above 1 suggests that Canada is a relatively attractive market for foreign investment, it significantly lags the top peer performers like Belgium, Ireland and Denmark.
Why is Belgium such a special case on inward FDI?
Belgium achieved an inward FDI index result of 8 in 2011, three times higher than the second-ranked comparator country, Ireland. Belgium’s FDI index result has never dipped below 3.4 and has twice exceeded a result of 13 in the past decade.
Why is Belgium such a special case? It works actively to attract inward foreign direct investment by using tax and other incentives to lower corporate income taxes and create a more tax-competitive business environment. Belgian firms then recycle this capital to corporate entities in other countries in the form of loans. Consequently, Belgium has one of the most internationalized economies in the world, with foreign affiliates accounting for about 35 per cent of manufacturing jobs and 21 per cent of services jobs.1
Who falls below Canada in the peer rankings?
Ten countries fall below Canada in the inward FDI rankings, and all receive “D” grades. Of these ten countries, eight are not attracting a global share of FDI that equals the size of their economies and have an Inward FDI Performance Index that is less than one. For example, the U.S. index is 0.7, placing it 10th among the peer group.
In 2011, Japan and Switzerland actually saw a net negative result for their Inward FDI Performance Index, meaning their stock of inward FDI declined. This weak result reflects a variety of factors, including the short-term impact of the tsunami and earthquake in Japan, business strategies and negative asset valuation adjustments by firms, and the impact of dividend payments and transfer pricing.
What are the benefits of inward FDI for Canada?
With trade liberalization and the rise of global supply chains, FDI is being used increasingly to restructure business operations, stimulate trade, and enhance profitability, thus expanding national wealth. Traditional international trade theory saw FDI as a substitute for international trade—a way to avoid tariff barriers—such as by setting up branch plants in another market. The new international trade paradigm—“integrative trade”—recognizes that inward FDI enhances the ability of firms and countries to expand production, resulting in more economic activity, more jobs, and income gains. Countries now compete to attract FDI inflows and international business activity.
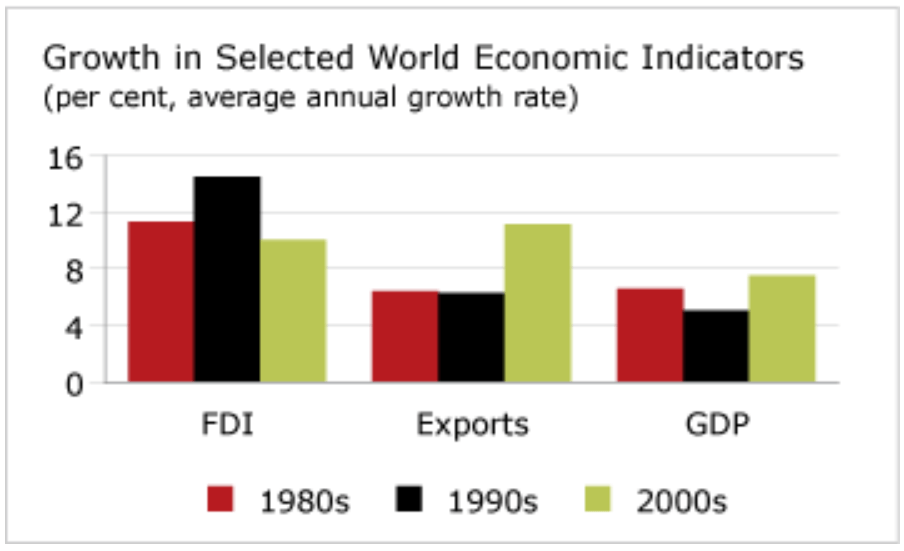
FDI has become a key driver of global economic growth. FDI activity has increased around the world, outpacing growth in production and in international trade. In the 2000s, global GDP increased by an average of 7.6 per cent per year, while the flow of FDI worldwide grew by 10 per cent per year.
Countries compete to attract FDI because FDI inflows can help boost productivity. FDI encourages the diffusion of technology management know-how, as well as more efficient resource allocation. Subsidiaries acquire new knowledge and technologies from their international parent. Domestic firms that interact with these subsidiaries also benefit from these transfers of technology and knowledge. Ultimately, FDI leads to higher productivity, improved quality of products, and increased competitiveness. Studies show that foreign-controlled firms, on average, are 10 to 20 per cent more productive than domestically controlled firms because of their superior technological and managerial know-how.
Inward FDI also increases the pool of investment capital. Rather than replacing domestic investment, FDI supplements capital shortfall and helps to develop home capital markets by creating additional export possibilities.
Finally, inward FDI increases revenues for government both directly, through taxes paid by foreign investors, and indirectly, through additional employment income taxes and sales taxes generated by increased consumer spending.
Has Canada been attracting its fair share of FDI?
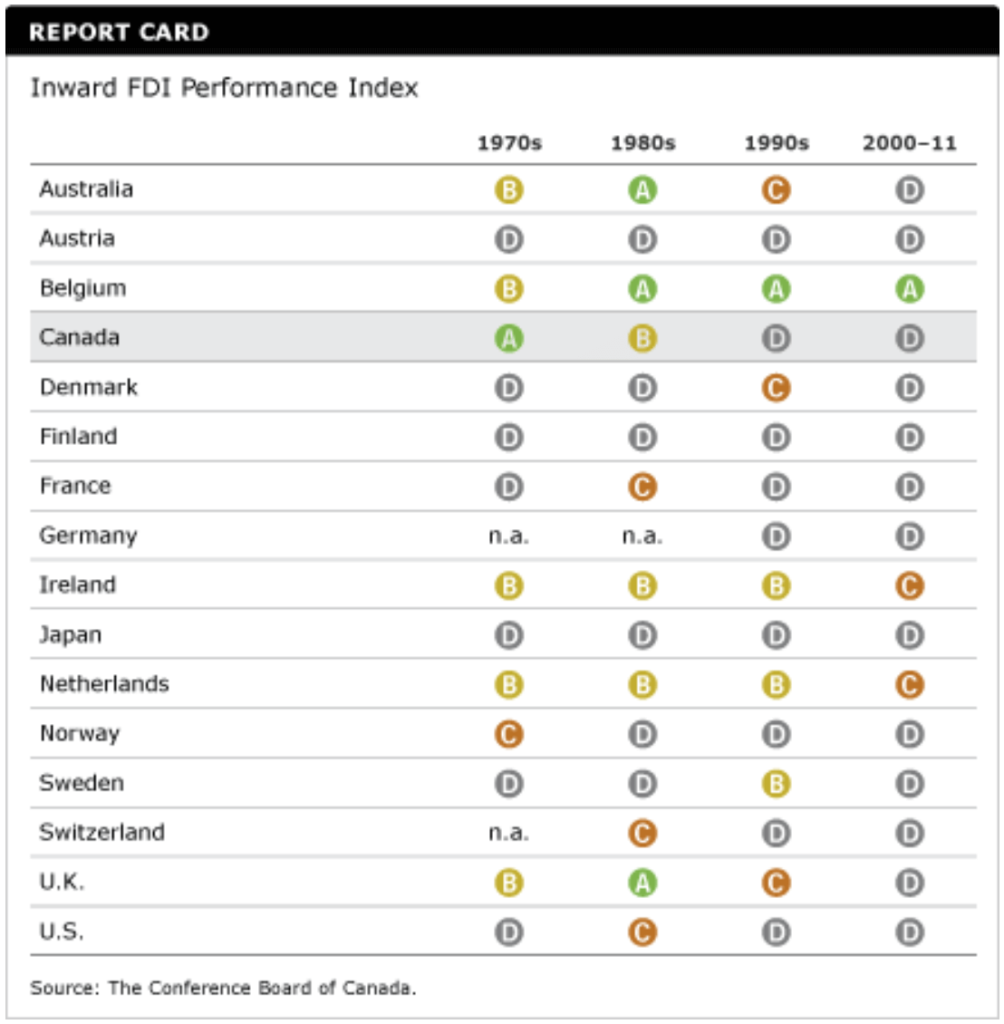
Since the 1970s, Canada’s ranking on foreign direct investment inflows has been slipping. In the 1970s, Canada scored an “A” on its ability to attract FDI. This dropped to a “B” in the 1980s and to a disappointing “D” average in the 1990s, rebounding to a “C” only in 2011.
Canada’s share of global inward FDI stock fell from an average of 13.4 per cent in the 1970s to an average of 2.9 per cent in the 2000–11 period.
To better understand Canada’s FDI performance:
The Role of Canada’s Major Cities in Attracting Foreign Direct Investment (Ottawa: The Conference Board of Canada, 2012).
Fear the Dragon? Chinese Foreign Direct Investment in Canada (Ottawa: The Conference Board of Canada, 2012).
Why has Canada become a less attractive destination for FDI?
Canada has lost some of its lustre on all three of the main factors that affect FDI investment decisions:
- access to markets
- access to resources
- opportunities to gain operational efficiencies
Investment to obtain Canadian market access has declined because the Canadian market is relatively small and the North American Free Trade Agreement has not attracted the predicted investments to Canada.
Canada receives a higher share of its FDI in the primary resource sector than do other countries. But while Canada’s natural resources are attractive to foreign investors, they can be more costly to explore and to exploit than elsewhere.
Multinational enterprises looking for operational efficiencies are dissuaded by Canada’s low productivity relative to its peers. Canada’s low productivity reflects its lower capital intensity and a lack of sufficient investment in research and development (R&D) and other areas that would foster innovation. Although Canada has a skilled workforce, it needs more specialized workers such as engineers, scientists, and technicians to compete for investment. Canada has neither the low cost of production of developing countries nor the scale of production of large economies like the United States.
Another factor—regulatory barriers to foreign investment—is often cited as a reason for relatively low inward FDI into Canada. Although some steps are being taken to reduce regulatory barriers to foreign investment, recent cases such as BHP Billiton’s aborted effort to purchase PotashCorp, as well as controversy over CNOOC’s acquisition of Nexen, may have created an impression of arbitrary policy decision-making on foreign acquisitions in Canada. Reduced regulatory barriers and greater clarity on how decisions are taken would help to build Canada’s attractiveness as an investment destination.
Is the geographic pattern of FDI changing?
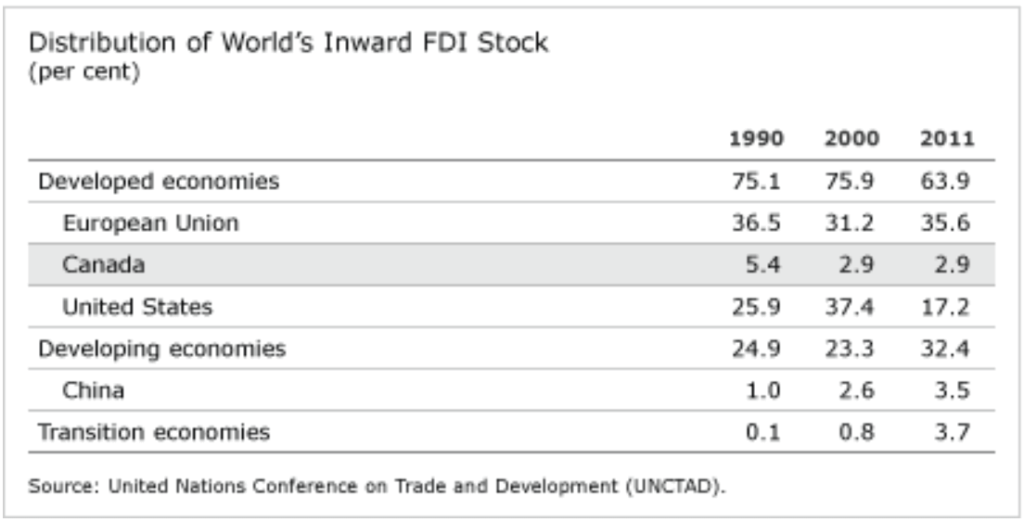
The U.S. remains the world’s most favoured FDI destination country, yet its popularity has diminished in recent decades. In 1990, the U.S. held 25.9 per cent of global inward FDI stock. This share fell to 17.2 per cent in 2011. China’s share of global FDI stock grew from 1 per cent in 1990 to 3.5 per cent in 2011, while transition economies increased their share from 0.1 per cent in 1990 to 3.7 per cent in 2011.
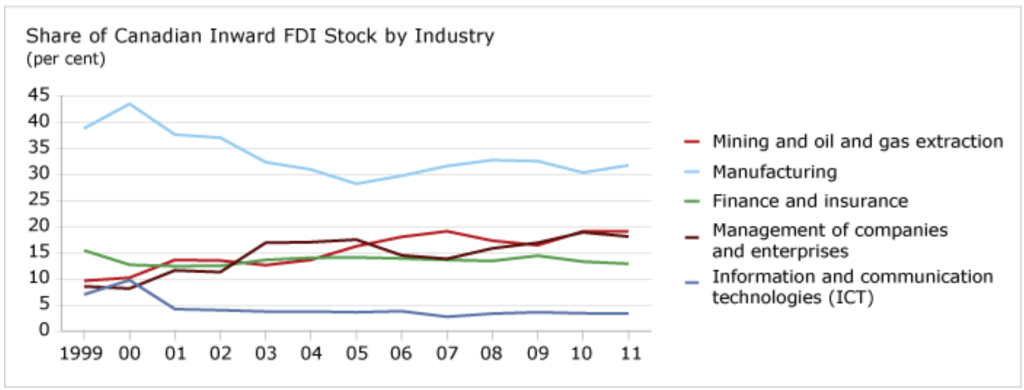
What Canadian industries are most attractive to foreign investors?
Although the manufacturing sector still occupies the top position, at 32 per cent of inward FDI stock, Canada’s mining and energy sectors have slowly climbed to second place, at 19 per cent. Management of companies and enterprises has crept into third place (18 per cent), while the share for finance and insurance industries is in fourth place at 13 per cent.
Footnotes
1 Filip De Beule and Daniel Van Den Bulck, Inward FDI in Belgium and Its Policy Context (New York: Vale Columbia Center on Sustainable International Investment, 2010).