
Inflation
Key Messages
- Almost all the provinces get an A grade for inflation in 2016.
- The only exception is Quebec, which gets a B with 0.7 per cent inflation in 2016.
- Inflation in Canada has been relatively stable over the past two-and-a-half decades, and that is unlikely to change in the near future.
Putting inflation in context
Inflation is measured by tracking the cost of a basket of goods and services used by a typical consumer. For example, if the inflation rate for a given region was 2.52 per cent in 2016, a basket of goods that cost $100 in 2015 would cost $102.52 in 2016. Ultimately, inflation erodes the purchasing power of personal incomes; that is, it reduces the quantity of goods that can be purchased with a given amount of money.
Inflation was a serious problem for many industrial countries in the late 1970s and 1980s, including Canada, where it peaked at 12.5 per cent in 1981. Two upward oil price shocks and a growing money supply were the key factors behind this inflationary period. The Bank of Canada then adopted an inflation control target in 1991. The target band is inflation as measured by the annual change in the consumer price index (CPI) of between 1 and 3 per cent, with a midpoint target of 2 per cent. Since 1992, the average rate of inflation has been 1.8 per cent.
Hyperinflation—or “out of control” inflation—can lead to the breakdown of a country’s monetary system and to social and political unrest. Canada has fortunately never experienced hyperinflation, which has generally been associated with developing countries in Latin America. Currently, Venezuela has the highest inflation rate in the world, with official inflation of 274 per cent in 2016 (the true figure is likely much higher). Even at the official rate, that implies that prices are doubling every three months. The country has been suffering from hardship and social unrest as a result.
In developed countries today, though, high inflation is less of a concern than low inflation. The year 2015 was the first since 1932 in which inflation fell below 2 per cent in each of the G7 major economies.
Since the financial crisis, economists in developed countries have become more concerned about the risks of deflation—the sustained fall in prices for a broad range of goods and services. Deflation is the opposite of inflation and usually occurs during a depression. During deflation, individuals and businesses know that a given product will be cheaper next month than today, so they hold off on making purchases, which harms consumption, production, and employment.
How do we grade inflation performance?
We award an A grade to inflation that falls within the Bank of Canada’s inflation-control target range: between 1.0 and 3.0 per cent. Inflation outside this target range (either above or below) gets a lower grade. The further away from the target range, the lower the grade.
Countries or provinces with inflation between 0.5 and 0.9 per cent or between 3.1 and 3.5 per cent earn a B. Inflation between 0 and 0.4 per cent (i.e., a signal that a country or province is slipping toward deflation) or between 3.5 and 4.0 per cent gets a C. The lowest grade, D, is given if inflation is above 4.0 per cent (i.e., over twice as high as the Bank of Canada’s target rate of 2 per cent) or if there is deflation.
How do the provinces score on inflation?
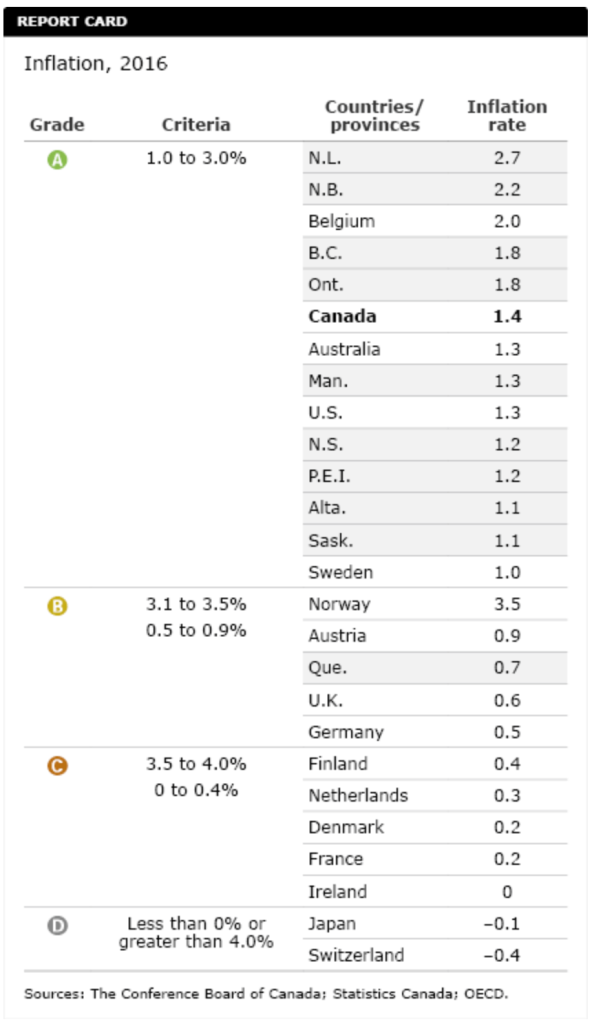
 Apart from Quebec, every province gets an A for its 2016 inflation rate. Inflation ranged from a low of 0.7 per cent in Quebec to a high of 2.7 per cent in Newfoundland and Labrador.
Overall, Canada scores an A, since its inflation rate of 1.4 per cent in 2016 was well within the Bank of Canada’s target range of 1 to 3 per cent. Canadian provinces’ inflation grades put them ahead of most of the peer countries. Only Belgium, Australia, the United States, and Sweden are A performers; of the rest, most had inflation in the 0 to 1 per cent range in 2016. Japan (–0.1 per cent) and Switzerland (–0.4) gets Ds for deflation in 2016.
Differences in inflation among the provinces can reflect a general change in taxes on products (such as a change in the sales tax) or specific taxes on products such as gasoline, alcohol, or cigarettes. Also, a surge in economic growth can lead to higher inflation in certain provinces as rising demand boosts wages and prices. In the mid-2000s, inflation in Alberta was higher than the national average because of the booming economy fuelled by the development of the oil sands. However, inflation in this province has subsequently come down to rates more in line with the rest of the provinces.
How do the territories rank on inflation?
The territories all get A grades, with inflation rates that fell within the Bank of Canada’s inflation-control target range of between 1 and 3 per cent in 2016.
N.W.T.’s inflation rate was 1.2 per cent, while Nunavut’s was 2.5 per cent. Yukon was close to the cut-off, however, with an inflation rate of exactly 1 per cent. That is an improvement from 2015, when the territory had deflation of 0.2 per cent. But Yukon’s economy is likely to have a difficult couple of years. Until commodity prices improve, deflation remains a concern there.
The territories are not included in the overall rankings because data are not available for all the indicators in the economy report card. The Conference Board is, however, committed to including the territories in our analysis, and so we provide information on territorial performance when data are available, such as for inflation.
The Conference Board of Canada produces a biannual Territorial Outlook report that examines the economic and fiscal outlook for each of the territories, including output by industry, labour market conditions, and the demographic make-up of each territory. The Territorial Outlook can be accessed online through e-Library and for clients subscribing to e-Data.
Research on issues affecting the territories is also produced by the Centre for the North, a Conference Board initiative that began in 2009.
Why is inflation bad?
High inflation reflects a volatile economy in which money does not hold its value for long. Workers seek higher wages to cover rising costs and are not inclined to save because the cost of goods and services is expected to be even higher in the future. Producers in turn may raise selling prices to cover cost increases, and cut back production to control their costs (resulting in layoffs).
Citizens on fixed incomes—like many pensioners—are particularly hard hit by high inflation. While the wealthy can usually protect themselves against inflation by investing in assets—such as stocks, bonds, or property—that increase in value during periods of inflation, those on fixed incomes find the value of their income eroding. For example, if the inflation rate is 6 per cent, someone living on a minimum wage job is unlikely to receive a 6 per cent increase in income to compensate, and so that person’s purchasing power is reduced. This leads to an increase in income inequality, or a growing gap between the “haves” and the “have-nots.”
If deflation reduces the price of goods, why isn’t it a good thing?
A country will always have some goods or services with falling prices, like the decline in the cost of computers or cellphones. Price declines like these, due to productivity gains or technological progress, can be beneficial and can contribute to a better quality of life for Canadians.
But deflation is something entirely different: the simultaneous, sustained fall in prices for a broad range of goods and services. Deflation causes increases in real interest rates (interest rates adjusted for changes in prices), making it more expensive for firms and households to borrow. Consumers postpone purchasing goods and services they expect will be cheaper tomorrow. When deflation occurs, businesses can no longer expect growth in sales of products and services, leading them to cut back on production and employment. This leads to even lower demand for goods and, in turn, to lower prices.
History has shown that once deflation is set in motion, it is extremely difficult to stop. One of the most prominent recent examples is Japan, which has been drifting in and out of deflation since the early 1990s. The country’s prime minister, Shinzo Abe, has since 2012 been attempting to use a combination of stimulus spending, quantitative easing monetary policy, and economic reforms to stimulate the economy and promote inflation. Nonetheless, Japan suffered from 0.1 per cent deflation in 2016.
Elsewhere, the weak state of many European economies has led to worries about deflation, as consumer prices increased by just 0.2 per cent in the eurozone last year. The European Central Bank has pursued a program of quantitative easing since 2015 to help combat the risk of deflation, and inflation does appear to be rising slightly. However, it is still well below the ECB’s target of below but close to 2 per cent, and it remains to be seen whether the Bank has the political ability to continue the quantitative easing program.
Why hasn’t quantitative easing led to surging inflation?
Quantitative easing involves a central bank purchasing bonds—government bonds or other financial assets—to increase the reserves of the commercial banks. The hope is that the commercial banks will then lend this extra cash to borrowers and thereby stimulate demand in the economy. Purchases of government and other bonds by central banks also result in downward pressure on interest rates.
Quantitative easing programs are a relatively new addition to central bankers’ toolkits, with the first example in Japan around the turn of the millennium. When the U.S. Federal Reserve started its QE program after the 2008–09 recession, many observers predicted inflation would take off because of the surge in monetary stimulus. Fears about inflation were reflected in the price of gold—typically seen as a safe haven for spooked investors—which rose above US$1,800 per ounce in 2011. However, inflation remained benign despite the extra monetary stimulus, partly because many banks did not lend all the added funds in their reserves provided by the Federal Reserve. As a result, some observers have concluded the U.S. QE program effectively stimulated the economy without driving inflation too high.
The Bank of Canada has not engaged in quantitative easing, mainly because the economy—especially the housing market—emerged from the recession in better shape than in most other countries. The Canadian financial system also weathered the global financial crash of 2008–09 better than banking systems abroad.
Quantitative easing is a last-resort policy and is used only in cases when interest rates have fallen to effectively zero. The Bank of Canada would consider such an exceptional policy only if the Canadian economy started to slide toward deflation. The Conference Board’s base case forecast anticipates continued moderate growth with inflation near the Bank of Canada’s midpoint target.
Should the Bank of Canada change its inflation target?
The fear of deflation over the past few years has led some economists, such as Nobel laureate Paul Krugman, to urge central banks to increase their inflation targets to ensure that deflation doesn’t take hold. A higher inflation target could change expectations about inflation that would eventually feed into wages and other prices. However, central banks in the developed world fought hard in the 1980s to lower inflation expectations and are reluctant to see these gains evaporate.
Given the success of its 2 per cent inflation target, the Bank of Canada renewed the target in October 2016 for another five years.1 Canada has been an A performer with inflation in the 1 to 3 per cent range for every decade since the 1990s, so there is little immediate incentive for a change in approach.
Why hasn’t the falling loonie lead to soaring inflation?
The value of the Canadian dollar is closely tied to energy prices and has fallen with the decline in the price of oil. Since 2012, the Canadian dollar has lost 25 per cent of its value compared with the American dollar, falling from par to about 75 cents on the dollar. Yet inflation in 2015 and 2016 was lower than in 2010, 2011, or 2012, when the dollar was at par. If the falling value of our currency means we must pay more for the same goods, why haven’t we seen soaring inflation?
A decline in the exchange rate increases the cost of imported goods for consumers and the cost of imported inputs for businesses. However, lower energy prices have also lowered the cost of any good or service that relies on energy as an input, offsetting the impact of higher import prices. So, many of the goods in the CPI basket have become cheaper even as the value of the loonie has fallen.
The Bank of Canada has estimated that, in the long run, the overall pass-through of the exchange rate to consumer prices is only about 7 per cent.2 In 2015, it estimated that the low value of the dollar was responsible for about 1.0 percentage points of inflation.
Footnotes
1 Bank of Canada, Renewal of the Inflation-Control Target, October 2016, 18.
2 Laurence Savoie-Chabot and Mikael Khan, Exchange Rate Pass-Through to Consumer Prices: Theory and Recent Evidence, Bank of Canada, 2015, 7.