
Labour Productivity Growth
Key Messages
- B.C. is the top-ranked province, scoring an A+ with average labour productivity growth of 2.0 per cent between 2011 and 2015.
- Newfoundland and Labrador, the only comparator region where labour productivity has fallen, gets a D–.
- Overall, Canada posted strong labour productivity growth between 2011 and 2015 and gets a B, ranking 3rd among the 16 peer countries.

Putting labour productivity growth in context
Productivity is the single most important determinant of a country’s prosperity over the longer term. Countries and provinces that are innovative and able to adapt to the ebb and flow of the new global economy boast higher productivity and thus a superior standard of living. Productivity is a measure of how efficiently goods and services are produced.
As Statistics Canada notes, “growth in labour productivity is often influenced by the degree of diversity in the industrial structure. As a result, labour productivity tends to be more volatile in the smaller provinces.”1 Because of this, a five-year average is used for this indicator to avoid drawing spurious conclusions based on one year of data.
How do the provinces rank relative to Canada’s international peers?
Ireland is the top-ranking jurisdiction on labour productivity growth by a huge margin. The country recorded real GDP growth of 26 per cent in 2015. Because labour productivity measures the amount of GDP produced by each worker-hour in an economy, Ireland’s labour productivity growth skyrocketed to 22 per cent in 2015.
Irish economists have a number of explanations for this jump, but generally agree it is something of a statistical artifact. The growth was likely due largely to a change in the way investment is calculated from GDP figures in European Union countries. A corporation that headquarters in a country now has its assets and intellectual property added to the country’s capital stock, and the growth in their value is now included in GDP.2 Irish capital stock increased by more than 30 per cent in 2015; there is speculation that a large number of corporations changed their domicile to Ireland, or that one of the many large multinationals that register there for tax purposes may have seen a large return on its assets.3 Ireland’s economy is not large compared to the size of some of the corporations, like Apple, that domicile there for tax purposes, so changes in their fortunes could have a huge impact on Irish national statistics. In addition to the changes in the capital stock, there was a jump in the number of aircraft purchased by lessors headquartered in Ireland. Even though these may never actually be in the country, they count towards GDP.4
Irish economists point to consumer spending growth, which was (a still impressive) 4.5 per cent in 2015, as a better indicator of the true underlying growth rate.5
Averaged over the last five years, Ireland’s labour productivity growth of 6.4 per cent per year dwarfs the growth rate in every other peer country and Canadian province. Using our standard method of calculating letter grades6 would mean every province and peer country would get a D grade for labour productivity except British Columbia, which would get a C, and Newfoundland and Labrador, which would get a D–.
Given that Ireland’s 2015 GDP growth is a statistical artifact, we chose to simply give Ireland an A+ and then omit the country when calculating the letter grades for the other provinces and peer countries. The result is a much more reasonable distribution of grades that more accurately reflects the differences in performance among jurisdictions.
Excluding Ireland, B.C. is the top performer among the remaining peer countries and provinces and, therefore, earns an A+ for 2.0 per cent average labour productivity growth over 2011–15. This goes a long way to explaining why the province has scored so well on a number of the economy report card indicators this year: it has achieved remarkable productivity gains over the past five years.
Most of the provinces had labour productivity growth above the peer country median growth of 0.8 per cent. Manitoba and Saskatchewan both averaged 1.4 per cent labour productivity growth and, along with Australia (1.7 per cent), get As. Alberta is right behind them in the rankings, with 1.1 per cent average labour productivity growth and a B. New Brunswick (0.9 per cent) and Ontario (0.8 per cent) get Cs.
Quebec (0.7 per cent), P.E.I (0.6 per cent), and Nova Scotia (0.6 per cent) were just below the peer country median. Newfoundland and Labrador’s performance is concerning, though—with average labour productivity growth of –1.2 per cent, the province ranks well below all the peer countries and gets a D–.
Overall, Canada puts in a good performance relative to the peer countries, averaging 1.0 per cent labour productivity growth between 2011 and 2015. That puts it third overall among its peers, behind Ireland and Australia.
How do the provinces perform relative to each other?
The four Western provinces are the only ones with labour productivity growth above the Canadian average. These provinces’ economies tend to be more resource-based and drove Canadian economic growth in the first half of the decade.
However, the five-year average used means that the Prairie provinces benefit from their strong growth in the years leading up to the 2014–15 commodities price crash. As a result, the grades they earn on this report card are high compared with their more recent performance. Looking just at the most recent year available, 2015, would paint a less rosy picture for all three provinces, with Saskatchewan and Manitoba slipping to a C and Alberta slipping to a D–.
The central Canadian provinces of Quebec and Ontario rank just below the national average. New Brunswick also performs close to average, but the rest of the Atlantic provinces are at the bottom of the pack.
Newfoundland and Labrador is the only province to have suffered average declines in labour productivity growth from 2011 to 2015. The declining labour productivity in Newfoundland and Labrador is partly the result of declining oil production from the maturing of the offshore industry. Oil sector workers in the province may be working just as effectively as before, but with the maturing of the industry, output has been steadily declining. Other oil-rich provinces did not see a decline in labour productivity over the same period because oil production continued to grow in Western Canada.
Which is more important: productivity growth or productivity levels?
Although the focus in the media is most often on productivity growth rates, these rates do not tell the whole story. The actual level of productivity (that is, the dollar value of output per hour worked) is equally of interest. For example, although Newfoundland and Labrador has had by far the worst productivity growth in the country over the last few years, its level of labour productivity remains above the national average.
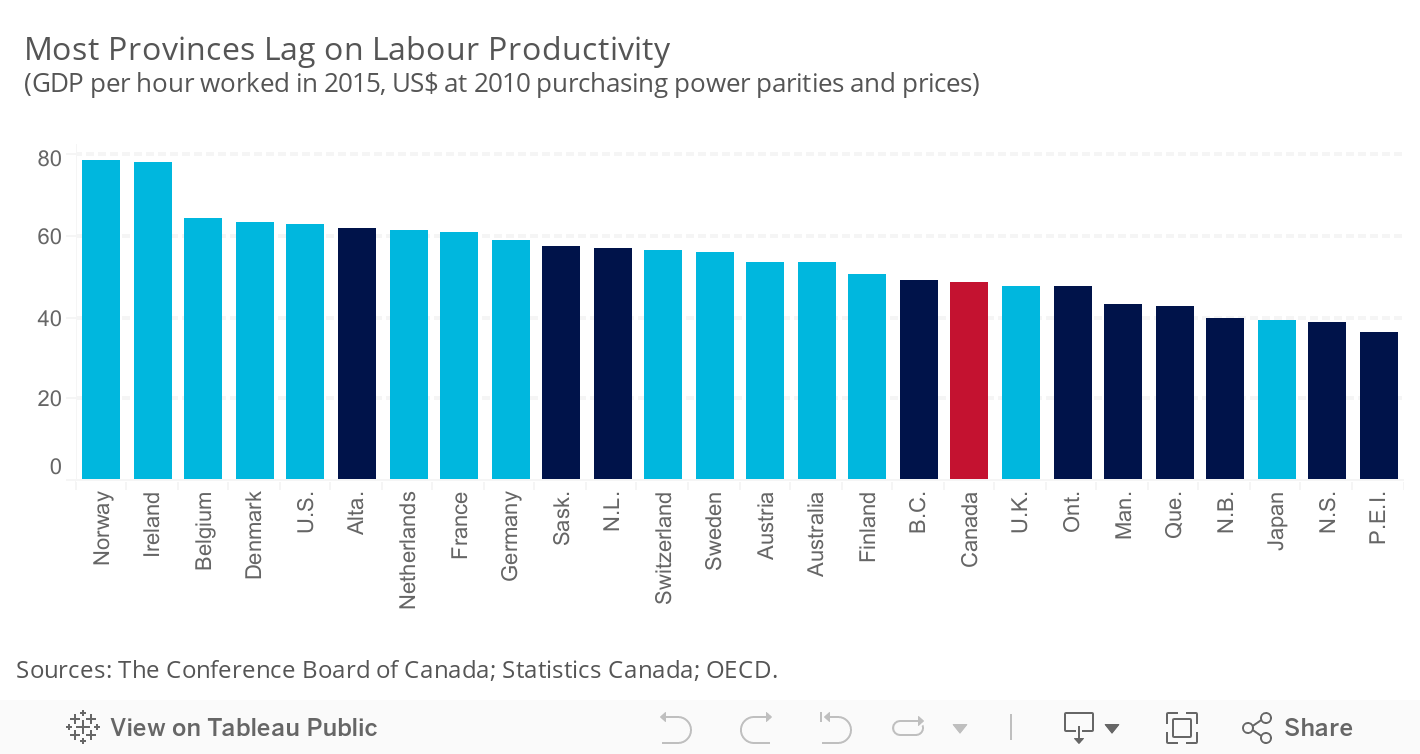
Low productivity levels present an enormous challenge for the future economic prosperity of most provinces. In 2015, Canada’s level of labour productivity was US$49 per hour worked, much lower than that of the United States, at US$63. As a share of the U.S. level, labour productivity levels in the provinces range from a high of 99 per cent in Alberta to a low of 58 per cent in Prince Edward Island.
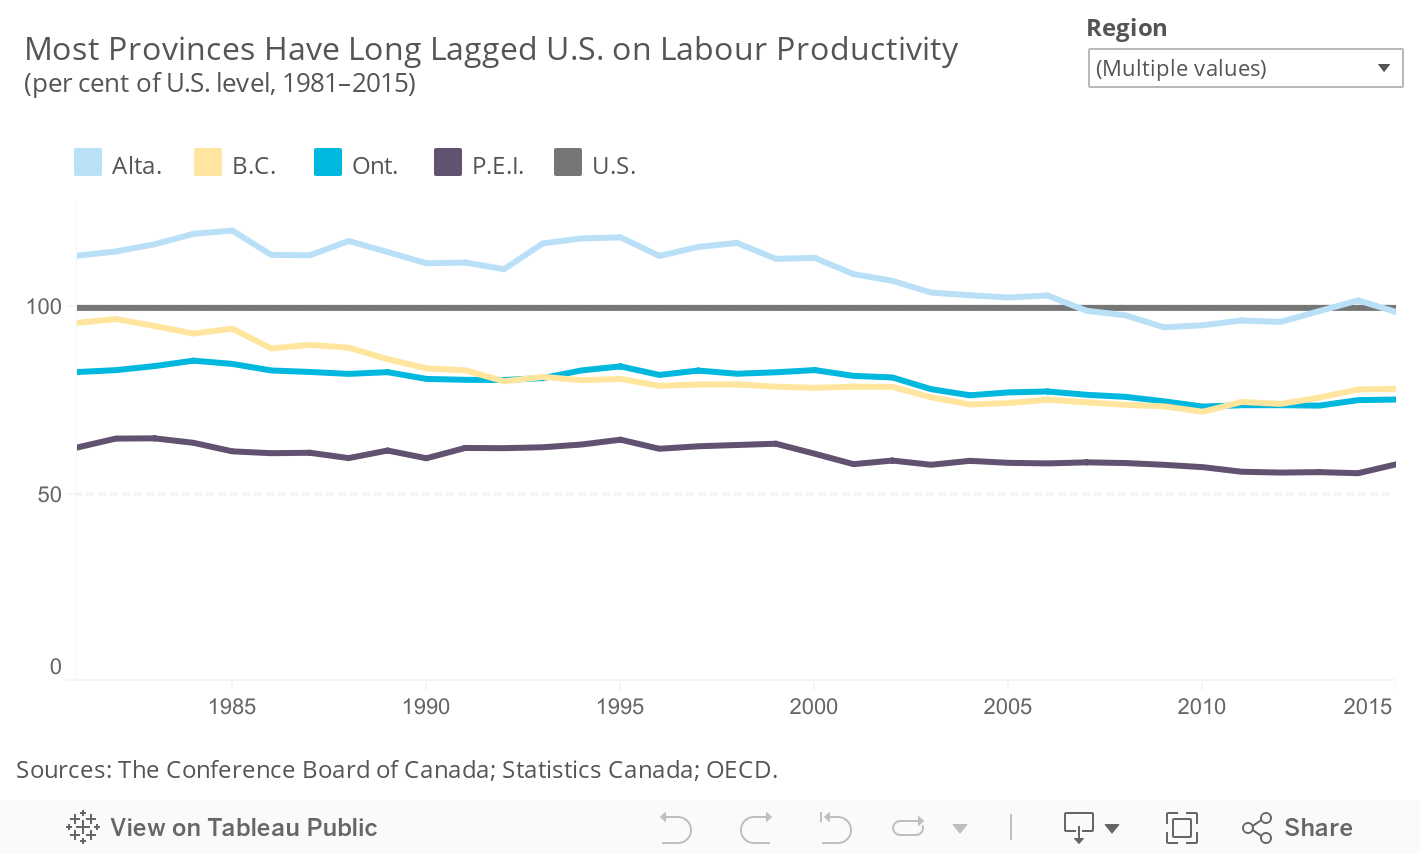
Worse still, these shares have fallen over time in all provinces but Newfoundland and Labrador. The largest decline was in British Columbia, where the level of labour productivity fell from 96 per cent of the U.S. level in 1981 to 78 per cent in 2015. Overall, Canada’s labour productivity as a share of the U.S. level declined from 89 per cent in 1981 to 77 per cent in 2015.
Over the last five years, however, Canada has outperformed the U.S. on labour productivity growth. It will have to keep repeating that feat for decades to close the still-sizable gap.
How do the territories perform on labour productivity?
The territories all get D– grades, with negative labour productivity growth over 2011–15. Nunavut’s labour productivity declined by an average of 0.5 per cent per year, Yukon’s declined by an average of 2.6 per cent per year, and the Northwest Territories’ declined by an average of 4.2 per cent per year. We have to interpret the results for the territories with caution since the labour data do not take into account the fly-in fly-out workforce that contributes to economic output and may influence the results.
However, the level of labour productivity in both the N.W.T. and Nunavut is high. At US$68 and US$66, respectively, N.W.T. and Nunavut’s labour productivity levels are higher than any of the provinces’, and higher than all peer countries save Norway and Ireland. Yukon’s labour productivity of US$44, however, is below the national average.
The territories are not included in the overall rankings because data are not available for all the indicators in the economy report card. The Conference Board is, however, committed to including the territories in our analysis, and so we provide information on territorial performance when data are available, such as for labour productivity growth.
The Conference Board of Canada produces a biannual Territorial Outlook report that examines the economic and fiscal outlook for each of the territories, including output by industry, labour market conditions, and the demographic make-up of each territory. The Territorial Outlook can be accessed online through e-Library and for clients subscribing to e-Data.
Research on issues affecting the territories is also produced by the Centre for the North, a Conference Board initiative that began in 2009.
Are Canadians not working hard enough?
Many people confuse the concept of productivity with that of work intensity. Improving productivity is not about working longer or harder; it’s about working smarter. It’s about finding more efficient and effective ways to produce goods and services so that more can be produced with the same amount of effort. It’s also about producing higher-value-added products and services that are worth more in the marketplace. The onus of improving productivity lies not just with governments, but also with individual firms and their management.
Take, for example, the auto manufacturer that introduces new robotics technologies that cut the time it takes to assemble cars, meaning that the same number of workers can now produce more cars per day, without working longer or harder. Or take the auto manufacturer that adds a GPS system to a car model that retails for $30,000. That innovative technology increases the sales price by $3,000. Because the redesigned car takes the same amount of time to build, however, labour productivity—in terms of output per worker—is boosted by 10 per cent.
What drives productivity growth?

The Conference Board has developed this diagram to illustrate the key drivers of productivity.
At the top are firm-specific factors. These factors relate to the physical and human capital, as well as innovation and technological change, in a particular organization.
The middle layer is the business and policy environment within which the firm-specific factors coalesce. For example, if an organization is in a highly competitive field, this competitive environment can have an indirect influence on productivity through its effects on the firm-specific variables.
The bottom layer is dynamics in the global economy. Canada has influence over some of these dynamics, such as trade liberalization. Others, like changes in global commodity prices, are essentially beyond the control of any individual country.
How can the provinces improve their productivity performance?
There is no silver bullet for improving productivity; many factors need examination.
Focusing on firm-specific factors, most provinces do fairly well on the human capital component. Canadian workers, relative to their international peers, are well educated and highly skilled. While there is room for improvement on adult literacy and numeracy skills, the quality of the labour force is not the driving force behind weak productivity growth.
When it comes to capital intensity (the amount of capital each worker has available, particularly machinery and equipment), provincial performance has been mixed. Not surprisingly, resource-intensive provinces are more capital intensive. The capital stock per worker in Alberta, Saskatchewan, and Newfoundland and Labrador is higher than the national average.
Investing in machinery and equipment—particularly information and communications technology—enables the adoption and diffusion of the latest state-of-the-art technologies, which in turn boost productivity. We know that countries with higher investment in machinery and equipment (M&E) generally have higher productivity growth. Canada’s investment in machinery and equipment as a percentage of GDP is among the lowest of its peer countries.
At the provincial level, it is again the resource-intensive provinces—Alberta, Saskatchewan, and Newfoundland and Labrador—that have comparable M&E investment per worker to the United States. Policies such as adopting a harmonized sales tax (where it is not already in place), providing investment tax credits, and reducing corporate tax rates and regulatory burdens are steps provinces can take to help boost investment and, subsequently, productivity.
Innovation, the third component of the firm-specific factors, is a key source of productivity gains and prosperity. The Conference Board defines innovation as a process through which economic or social value is extracted from knowledge—by creating, diffusing, and transforming ideas—to produce new or improved products, services, and processes. Despite nearly two decades of innovation agendas and prosperity reports, Canada has not made progress on foundational aspects of its innovation ecosystem, such funding for research and development. While there is no easy answer to improving innovation performance, research has shown that both public policy and business culture can help.
What is the link between labour productivity and per capita income?
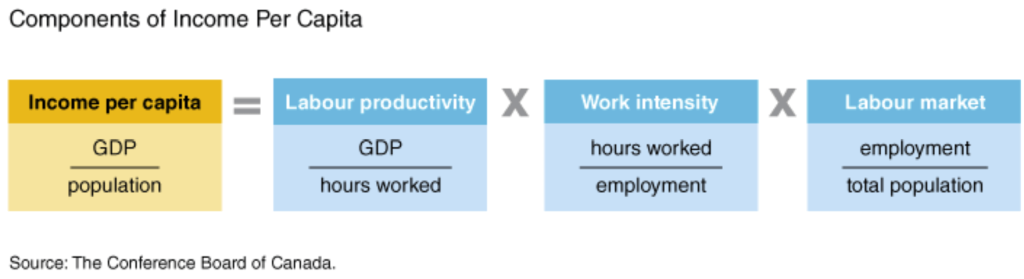
The most important determinant of a country’s per capita income, over the longer term, is productivity—both its level and its growth. Why? Because there is no limit to productivity growth. There is a limit to how many hours in a day employees can work, how low the unemployment rate can go on a sustained basis, how high the labour force participation rate can rise, and how large the proportion of working-age people in the total population can be. But innovation and technological change can sustain productivity growth indefinitely, driving the growth rate over time.
In the equation below, labour productivity is the only component with no upper limit. Therefore, improving productivity is the only sustainable way to reduce the sizable gap between provincial and U.S. income per capita.
Footnotes
1 Statistics Canada, Hours Worked and Labour Productivity in the Provinces and Territories, 2015.
2 The Economist, Ireland’s Economic Statistics: Not the Full Shilling, July 16, 2016.
3 Cliff Taylor, “Ireland’s GDP Figures: Why 26% Economic Growth Is a Problem,” The Irish Times, July 15, 2016.
4 Phillip Inman, “Irish Economy Surges 26% as Revised Figures Take in Foreign Investment,” The Guardian, July 12, 2016.
5 Eoin Burke Kennedy, “Handful of Multinationals Behind 26.3% Growth in GDP,” The Irish Times, July 12, 2016.
6 We calculate letter grades by taking the difference between the top-performing and the bottom-performing peer countries and dividing it into quarters. The top quarter receive As, the second quarter receive Bs, and so on. Using this standard methodology here and including Ireland, an A grade would be given to labour productivity growth of 4.8 per cent and above; a B would be given to labour productivity growth of 3.3 per cent and above; a C would be given to labour productivity growth of 1.7 per cent and above; and a D would be given to labour productivity growth of 0.2 per cent and above.