
Forest Cover Change
Key Messages
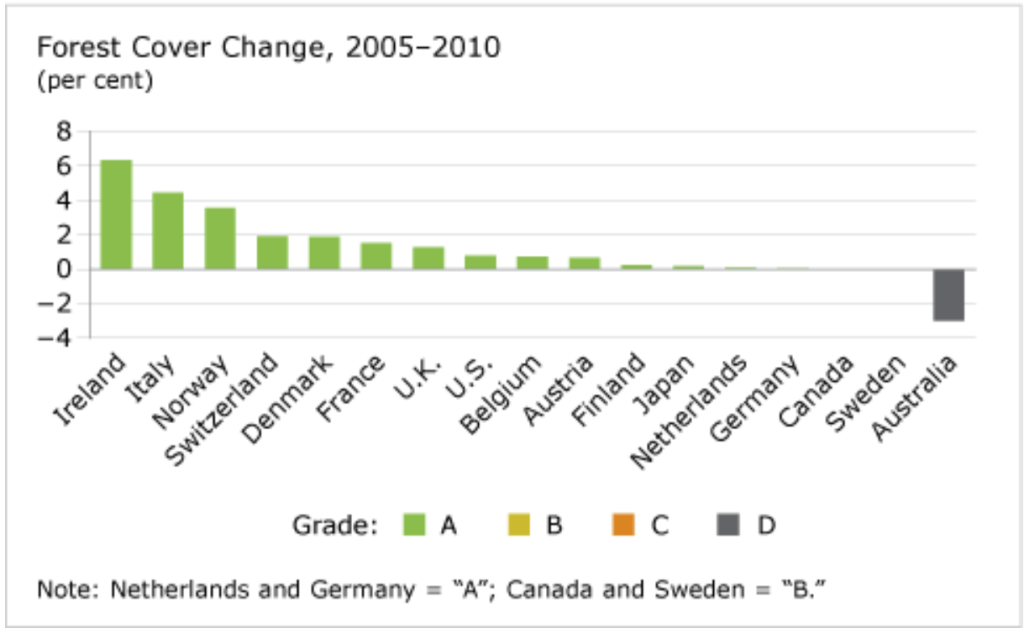
- Canada ranks 15th out of 17 countries for forest cover change over 2005 to 2010 and receives a “B” grade.
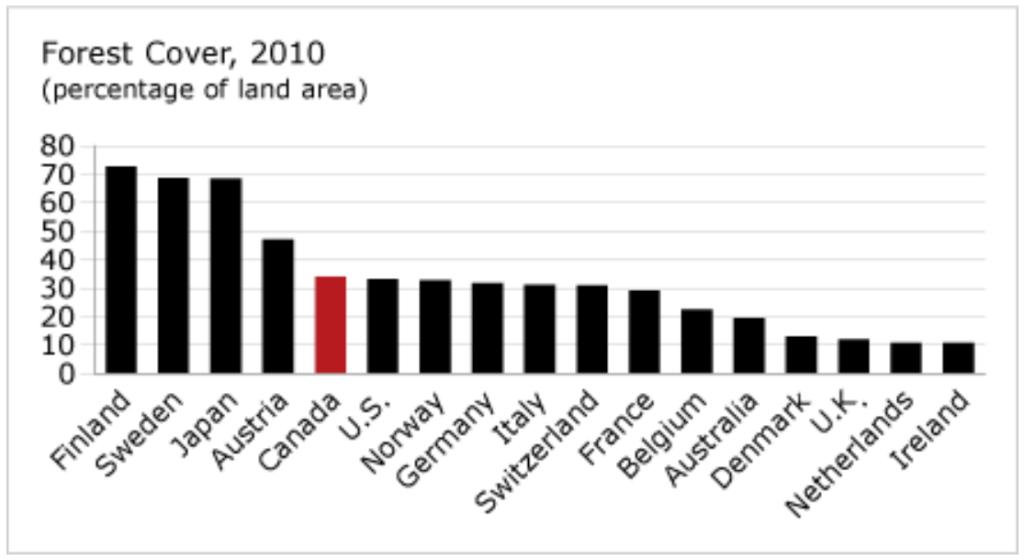
- Canada’s forest cover is being maintained at 348 million hectares, representing 34 per cent of Canada’s total land mass.
- Forest cover in Europe has increased thanks to afforestation (when trees are planted on land not previously forested).
Putting forest cover change in context
Canada’s forests cover about 34 per cent of Canada’s total land area. This immense forest cover is essential for maintaining biodiversity; it provides invaluable ecological goods and services, such as clean air, clean water, carbon sequestration, and flood control. Canada’s forests also provide habitat for two-thirds of Canada’s wildlife and contain 180 tree species native to Canada.1
Is Canada’s forst cover improving, maintaining, or being depleted?
Canada ranks 15th out of 17 peer countries for forest cover change over 2005 to 2010 and receives a “B” grade for performance. Canada’s forest cover and wooded area has remained fairly constant over the past two decades. Swedent also maintained its total forest cover and receives a “B” grade for performance.
But most of Canada’s peer countries increased their total forest cover over the same period and receive “A”s. Australia, which saw a decrease in forest cover, receives a “D.”
How does forest cover change occur?
An increase in forest cover can happen through either afforestation or natural expansion of forests. Afforestation occurs when trees are planted on land that was not previously forested. Natural expansion of forests refers to an expansion of forest through natural succession onto previously non-forested lands, usually abandoned agricultural land.
Reduction of forest cover is caused by deforestation or natural disasters. Deforestation implies that forests are cleared by people. The land is then converted to another use, such as agriculture or infrastructure. Natural disasters may also destroy forests. When the area is incapable of regenerating naturally and no efforts are made to replant it, it reverts to other land.
Where part of a forest is cut down but replanted (reforestation), or where the forest grows back on its own within a relatively short period (natural regeneration), there is no change in forest area.
How has Canada performed historically?
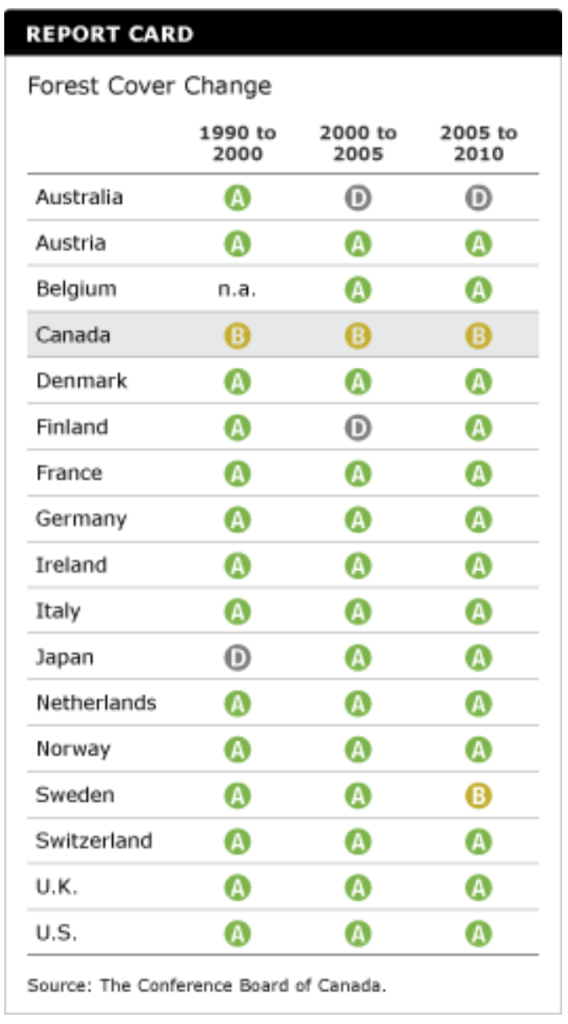
Since the 1990s, Canada has received a “B” grade on this indicator.
Forests cover 34 per cent of Canada’s land mass, and total forest cover has remained fairly constant at 348 million hectares for nearly two decades.
How does Canada maintain forest cover?
Provincial governments regulate forests on provincial Crown lands by setting an annual allowable cut (AAC)—the yearly level of harvest allowed on a particular area of Crown land over a specified number of years. Annual harvest amounts can be above or below the AAC, but must balance out over the regulation period.
Canada’s total volume of timber that can be harvested on all land types—provincial, territorial, federal, and private—has been relatively stable since 2000, averaging about 243 million cubic metres per year. The actual harvest has been below this amount.2
Why do other countries rank so much higher than Canada on the forest cover change indicator?
Most peer countries that rank ahead of Canada are in Europe. Forest area and growing stock have been increasing year by year in Europe because of decreased demand for wood as a domestic fuel source and the replanting of forests.3 Afforestation, however, remains a priority in Europe, as a result of overharvesting and intensive forestry practices in the past.
Ireland, the best performer recently, achieved a 6 per cent increase in forest cover from 2005 to 2010. Unlike Canada, Ireland witnessed centuries of forest exploitation, leaving less than 10 per cent of its land as forest cover by the end of the 20th century. In 1996, a strategic plan set an afforestation target of 25,000 hectares per year up to the year 2000, and 20,000 hectares per year from 2001 onwards.4 Although the targets are not being met, government incentives have encouraged private landowners to contribute to afforestation. In recent years, the Irish government has set a target of increasing forest cover to 17 per cent of total land mass by 2030.
Scandinavian countries introduced forestry legislation about 100 years ago limiting the amount of timber that could be harvested while imposing an obligation on woodlot owners to replant after felling. Since then, forest resources in these countries have doubled.5
For the most part, a higher proportion of forests in European countries are privately owned. In Norway, 86 per cent are privately owned; in Sweden, it’s 80 per cent; and in Denmark, 72 per cent of forests are under private ownership.6 The majority of the private ownership is in the hands of individuals and families, with only a small proportion owned by private institutions and forest industries. Private owners in these countries are required through policy and legislation to practice sustainable forest management—reforestation followed by harvesting. These practices have contributed to the increase in forest cover in these countries.
Footnotes
1 OECD, Environmental Performance Reviews: Canada (Paris: OECD, 2004), 85.
2 Natural Resources Canada, “Annual Harvest of Timber Relative to the Level of Harvest Deemed to Be Sustainable” (accessed November 17, 2012).
3 Faculty of Forestry and the Forest Environment, Lakehead University, Sweden—Forests and Forestry (accessed August 20, 2008).
4 Ireland Department of Agriculture, Food, and Forestry, Growing for the Future: A Strategic Plan for the Development of the Forestry Sector in Ireland (Dublin: Ireland Department of Agriculture, Food, and Forestry, 1996).
5 Faculty of Forestry and the Forest Environment, Lakehead University, Forest Management in Scandinavia (accessed August 20, 2008).
6 Andreas Schuck, “Forest Resources in Finland, Iceland, Norway, Sweden and the United Kingdom—a Background Note,” Working Papers of the Finnish Forest Research Institute 38: 7–13, Proceedings of ELAV seminar, March 23–24, 2006, Koli, Finland.