
Environment
Key Messages
- Canada receives a “C” grade on environmental performance and ranks 15th out of 17 peer countries.
- Canada’s success in improving its environmental performance has been mixed. It has improved air quality, reduced its energy intensity, and increased the growth of forest resources relative to forest harvest. But Canada must do more to lower greenhouse gas emissions, to use its freshwater resources more wisely, and to reduce waste.
- To improve its overall performance, Canada must promote economic growth without further degrading the environment, partly by encouraging more sustainable consumption.
Indicators
Putting Canada’s environmental performance in context
The Conference Board’s overarching goal is to measure quality of life for Canada and its peers. But a country must not only demonstrate a high quality of life—it must also demonstrate that its high quality of life is sustainable.
There is growing recognition that gross domestic product (GDP) produced at the expense of the global environment, and at the expense of scarce and finite physical resources, overstates the net contribution of that economic growth to a country’s prosperity. Canadians understand that protecting the environment from further damage is not a problem for tomorrow, but a challenge for today. Without serious attention to environmental sustainability, Canada puts its society and its quality of life at risk.
How do we measure environmental performance?
Fourteen indicators are used to assess environmental performance across six dimensions:
- air quality
- waste
- water quality and quantity
- biodiversity and conservation
- natural resource management
- climate change and energy efficiency
These six dimensions were selected based on the common environmental and natural resources policy themes identified in a review of respected national and international environmental reports.
What has changed in this report card?
Several changes have made the results from this year’s overall Environment report card not comparable to the last one:
- The data on urban nitrogen dioxide concentration are no longer available. Therefore, this indicator has been changed to nitrogen oxides emissions.
- The data on urban sulphur dioxide concentration are no longer available. Therefore, this indicator has been changed to sulphur oxides emissions.
- An additional species—freshwater fish—has been added to the threatened species indicator. This indicator now covers threatened mammals, birds, vascular plants, and fish species.
- The organic farming indicator has been dropped.
- The energy intensity indicator is now calculated as the level of total primary energy supply per US$1,000 GDP. It was previously calculated as the change in total primary energy supply per US$1,000 GDP.
How does Canada measure up?
Canada ranks 15th out of 17 peer countries and scores a “C” grade on its environmental performance report card. Canada’s poor record in several areas—including climate change, energy intensity, smog, and waste generation—drags down its comparative performance. Only Australia and the U.S. rank below Canada.
The top three performers are France, Norway, and Sweden.
The radar diagram below is a snapshot of Canada’s environmental performance (and the 17-country average performance) relative to that of the best-performing peer country—the outer ring—for each of the 14 environment indicators. The chart has 14 axes—one for each indicator—that radiate out from the centre. A score of 0 represents the worst performance. A score of 100 represents the best.
Compared with the 17-country average, Canada’s performance is above average on five indicators:
- use of forest resources
- low-emitting electricity production
- Water Quality Index
- threatened species
- particulate matter concentration
Canada’s performance is below average on nine indicators:
- forest cover change
- nitrogen oxides emissions
- sulphur oxides emissions
- Marine Trophic Index
- greenhouse gas (GHG) emissions
- water withdrawls
- volatile organic compound (VOC) emissions
- municipal waste generation
- energy intensity
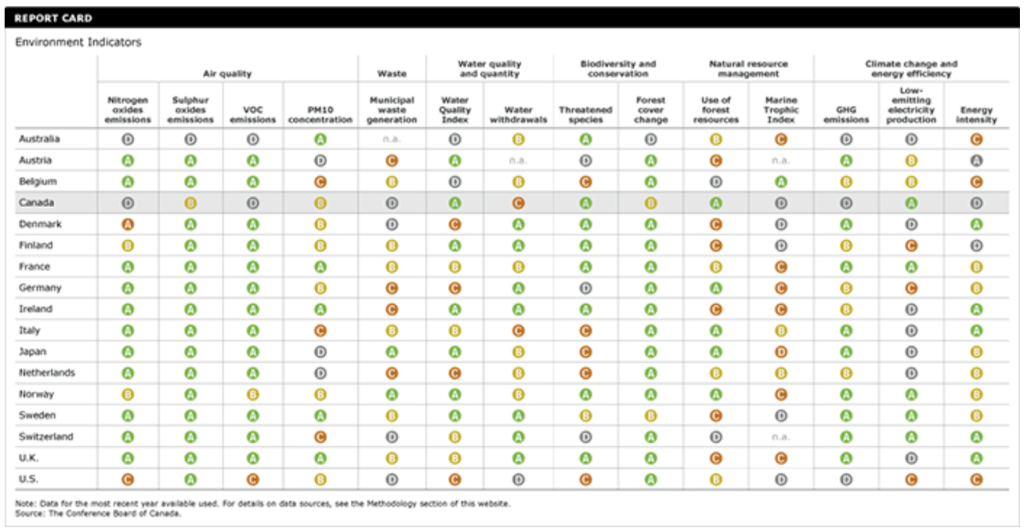
Although Canada ranks below the best-performing country on all of the environmental indicators, it does earn “A” grades for four indicators: Water Quality Index, threatened species, use of forest resources, and low-emitting electricity production. Canada receives “D” grades on six indicators: nitrogen oxides emissions, VOC emissions, municipal waste generation, Marine Trophic Index, GHG emissions, and energy intensity.
Do geography and industrial structure affect environmental performance?
They matter. The three countries that rank lowest in the overall ranking are the U.S., Australia, and Canada. Not only are they among the most resource-intensive economies in the Organisation for Economic Co-operation and Development (OECD), but they are also the three largest countries in terms of land area. They rank poorly on nitrogen oxide emissions, VOC emissions, Water Quality Index, Marine Trophic Index, GHG emissions, and energy intensity.
It is difficult to target a single cause of their poor environmental performance. But resource extraction and processing industries often use a lot of water and may contribute to greater stresses on local air quality. Further, greater distances mean that greater amounts of energy are required to transport people and to move goods to where they will be consumed, leading to greater GHG emissions.
Geography and industrial structure are hurdles to overcome—through technology, innovation, efficiency, and behavioural changes—in improving Canada’s environmental performance.
To understand more about how Canada can integrate economic growth and environmental sustainability:
Sustainability: A Winning Merger of Growth and the Environment, Ottawa: The Conference Board of Canada, 2006.
Air quality: Does Canada have clean air?
Air quality affects human health, ecosystems, and buildings—often with far-reaching economic and social consequences. Human exposure to air pollution is high in urban areas where economic activities and road traffic are concentrated
Although Canada gets a respectable “B” on the sulphur oxides indicator, its per capita emissions are 26 times those of the top performer, Switzerland. Only relative to Australia does Canada perform well. If the worst performer, Australia, were dropped from the peer group, Canada would receive a “D” grade. Canada does receive a “D” grade on nitrogen oxides emissions.
Increasing air quality concerns include particulate concentrations, toxic air pollutants, and acute ground-level ozone pollution. Canada ranks 8th out of the 17 peer countries for PM10 concentration, and earns a “B” grade. But Canada is the worst performer for VOC emissions. VOCs—produced from vehicle emissions and chemical manufacturing—combine with nitrogen oxides to produce smog and ground-level ozone, resulting in a number of health impacts.
The main challenge for Canada is to further reduce urban and regional air pollutants through pollution control, technological progress, energy savings, and sustainable transportation.1
Waste: Is Canada a throwaway society?
Municipal waste contributes to environmental problems such as habitat destruction, surface and groundwater pollution, and other forms of air, soil, and water contamination. Canada earns a “D” for municipal waste generated per capita and ranks last among its peers. In 2008, Canada generated 777 kilograms of municipal waste per capita, well above the 17-country average of 578 kg per capita. Compared with Japan, the top-performing country for this indicator, Canada generated more than double the municipal waste per capita.
Of the nearly 34 million tonnes of waste generated in Canada in 2008, 26 million tonnes went to landfills or incinerators. The rest was diverted through recycling or composting.2 Landfilling is the most common way to dispose of waste in Canada. But landfills emit methane (a GHG that contributes to climate change), and the leachate from landfills causes groundwater and surface water contamination. Therefore, reducing the damage to the environment of municipal waste generation in Canada requires minimizing waste, increasing waste recycling and recovery, and disposing of any remaining waste in an environmentally benign manner.
The amount of municipal waste generated in a country is related to the rate of urbanization, the types and patterns of consumption, household revenue, and lifestyle choices. In Canada and across the OECD, real GDP and average household disposable income have been steadily increasing since the 1980s, leading to increasing household consumption rates. Canada cannot keep growing its economy at the expense of the environment. Encouraging sustainable consumption patterns will continue to be a challenge.
Water quality indicators: Is Canada’s water at risk?
The health and well-being of ecosystems depends heavily on the quality and quantity of water resources. Water is essential for agriculture, livestock production, fisheries and aquaculture, municipalities, and industry. Water pollution (eutrophication,3 acidification, toxic contamination) can harm human health and ecosystems, and increase the cost of treating drinking water. The Water Quality Index—which measures dissolved oxygen, pH, conductivity, total nitrogen, and total phosphorus—is used as indicator of eutrophication, nutrient pollution, acidification, and salinization.
Canada ranks 4th out of 17 peer countries and earns an “A” for water quality. Sweden, Austria, and Norway rank ahead of Canada and earn “A”s. Canada’s water quality is at risk from industrial effluent, agricultural runoff, and municipal sewage. Although waste-water treatment plants have helped to improve water quality, municipal waste-water discharges are still one of the largest sources of pollution in Canadian waters. As a result, eutrophication is a serious water quality issue for the Prairie provinces, southern Ontario, and southern Quebec. The increase in toxic algal blooms in Canadian lakes and coastal water is also a risk to human health. And the drinking water guideline for nitrate has been exceeded in groundwater across Canada.
High water withdrawls are also a key environmental issue; they relate to low river flows, water shortages, salinization of freshwater bodies in coastal areas, human health problems, loss of wetlands, desertification, and reduced food production. Sustainable water management is required to maintain adequate water supplies for people and ecosystems.
Water withdrawls are measured using gross freshwater withdrawals per capita. Canada receives a “C” for water withdrawls—Canada’s water withdrawals are nearly double the 16-country average. Canada uses more than nine times the amount of water per capita than Denmark, the top performer in this indicator. Only the U.S. ranks behind Canada on this indicator.
Biodiversity and conservation: Is Canada protecting its forests and wildlife?
Biodiversity and the habitat and ecosystem services4 that biodiversity provides are increasingly recognized as an important part of sustainable development. Protected areas have grown in most OECD countries; however, pressures on biodiversity and threats to global ecosystems and their species are increasing. Consequently, many natural ecosystems have been degraded, limiting the ecosystem services they provide.
Canada scores an “A” on threatened species as a percentage of total known species in the country. Canada’s vast uninhabited forests, wetlands, and tundra regions support a wide range of plant and animal life and will continue to be protected by sheer remoteness. However, the quest for natural resources is increasing in intensity, and developers are looking farther afield for opportunities.
Forests provide habitat for wildlife, clean air, carbon sequestration, clean water, and flood control. Canada’s forest cover is key to biodiversity, as it provides habitat for two-thirds of Canada’s wildlife. Canada rates a “B” on the forest cover change indicator, which measures the percentage gain or decline in forest cover from 2005 to 2010. Countries such as Ireland, Italy, Denmark, and the U.K., expanded their forest coverage over the same period and earned “A”s. Canada’s “B” reflects its ability to maintain (but not increase) its forest cover. It does, however, perform better than Australia, which lost forest cover from 2005 to 2010.
The fact that Canada’s forest land inventory has remained constant since 1990 indicates that land use within the forest is not changing. Canada’s ability to maintain its forest cover—despite having the most extensive forestry harvests of its peer group—is largely because of the extensive licensing system that oversees the forest industry and because of the industry’s own efforts to ensure good practices through forest certification.
Canada’s stable forest land inventory also bodes well for habitat preservation, as long as forestry policy ensures the protection of wildlife. Although aggregate numbers indicate healthy biodiversity, the impact of urban sprawl and agricultural land and forest use on wildlife habitat needs to be monitored at a regional level. Protective measures and policy vigilance are particularly important in places where specific species are threatened.
Natural resources management: Are Canada’s resource practices sustainable?
Productive natural resources such as forests, soil (for agriculture), fresh water, and fisheries are crucial to Canada’s economic activity. Unsustainable agriculture practices can contribute to soil nutrient depletion, erosion, and water pollution. Fisheries are also being depleted because of unsustainable industrial fishing practices and a lack of a global regulatory framework to support sustainable fishing.
Canada is one of the best performers for the intensity of use of forest resources. It gets an “A” for performance on this indicator. Only Japan ranks ahead of Canada, with a lower percentage of timber cut relative to forest growth. In Canada, 93 per cent of the forest area harvested is clear-cut, and most timber harvesting in Canada occurs in primary or old-growth forests. However, Canada has the world’s largest area of forest certified to third-party sustainable forest certification. Sustainability certification means harvesting at a rate that is at or below the rate of regrowth and replacement, suggesting that the harvest can continue over the long term.
The Marine Trophic Index serves as a proxy measure for overfishing. By examining the change in the Marine Trophic Index over time, we can measure the degree to which a county is altering the fish stocks in the marine ecosystem. Canada’s fish resources have been declining since the 1970s. Canada receives a “D” because of a decline in the Marine Trophic Index between 2000 and 2006. Belgium is the only OECD country to receive an “A” for its significant improvement in its Marine Trophic Index, although eight other countries also achieve a positive change for this period.
Climate change and energy efficiency: Has Canada made progress against climate change?
Finding adequate and comparable measures for climate change poses a significant challenge. It is not possible to obtain a reasonable national indicator of the effects of global climate change because it is a major global issue that requires a policy response from Canada and the other peer countries. That is why we use a proxy indicator: greenhouse gas (GHG) emissions per capita.
Canada, one of the world’s largest GHG emitters, earns a “D” for its GHG emissions per capita. In 2010, Canada’s GHG emissions were 20.3 tonnes per capita—significantly higher than the 17-country average of 12.5 tonnes per capita. Between 1990 and 2010, Canada’s per capita GHG emissions decreased by nearly 5 per cent, while total GHG emissions in Canada grew by 17 per cent.
The primary reason for the increase is growth in such exports as petroleum, natural gas, and forest products. While these commodities are exported, the GHG emissions resulting from their production are not. Most of our mining, forest, and oil sands products are exported to other countries—which receive implicit CO2 benefits from the highly CO2-intensive production in Canada. Although Canada’s total GHG emissions represent only 2 per cent of worldwide GHG emissions, there is significant room for improvement through increased energy efficiency and the use of lower-emitting technologies.
Boosting renewable energy as a share of total energy consumption should be a policy goal for climate change mitigation in Canada. Renewable sources of energy—wind, tidal, solar, biomass, hydroelectric, and geothermal—produce low amounts of GHG emissions. In 2011, almost 78 per cent of Canada’s electricity was produced from low-emitting sources (renewable, plus nuclear). Because of Canada’s expansive hydro resources, Canada receives a “A” on this indicator. Canada could do more, however, to increase its share of low-emitting electricity production in total electricity production. For example, almost all of Norway’s electricity is generated from renewable hydroelectric sources.
Total energy consumption (measured in millions of tonnes of oil equivalent, or toe) per unit of GDP can be used as an indicator of energy efficiency. Canada receives a “D” for its energy intensity in 2009, ranking in last place out of 17 peer countries. That year, Canada used 0.25 toe per US$1,000 of GDP, significantly more than the OECD average of 0.15 toe per US$1,000 of GDP. Ireland is the best performer on this indicator, followed by Switzerland and Italy.
Has Canada’s environmental performance improved?
Canada’s environmental performance has improved for several of the environment indicators and deteriorated for others. Historical data were available for 13 of the 14 environment indicators, spanning five of the six environment dimensions. The only indicator with no historical data is the threatened species indicator.
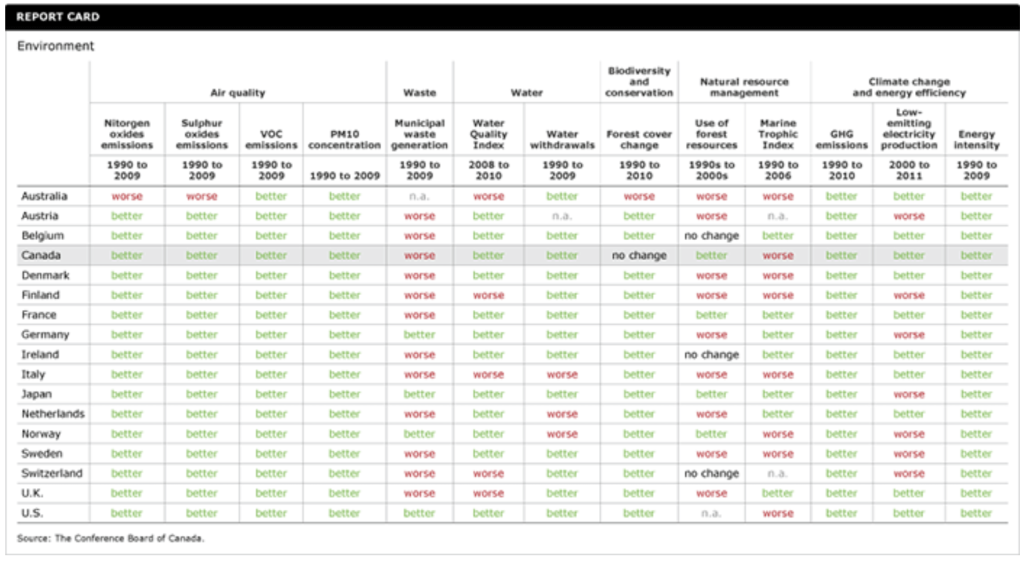
The Conference Board ranks the change in performance on each environment indicator as “better,” “worse,” or “no change” (rather than A-B-C-D) and uses absolute performance (rather than relative performance, as in other main report card categories).
Canada’s performance has improved for ten indicators in the overall Environment report card, stayed the same for one indicator, and worsened for two indicators.
Canada’s performance on all four air indicators improved between 1990 and 2009:
- nitrogen oxides emissions per capita fell by 34 per cent
- sulphur oxides emissions per capita fell by 62 per cent
- VOC emissions per capita fell by 41 per cent
- PM10 concentrations fell by 37 per cent
But compared with the top-performing countries, Canada’s reductions are modest. For example, the top country on per capita nitrogen oxides emissions, the U.K., achieved a 62 per cent reduction. Similarly, Canada’s 41 per cent reduction in per capita VOC emissions lags Switzerland’s 73 per cent reduction.
Canadians have been producing more and more garbage. Canadians generated 777 kg of municipal waste per capita in 2008, up from 654 kg in 1990. Although the quantity of municipal waste generated per capita has been rising across the OECD, the amount of municipal waste generated in Canada has been well above the OECD average.
Canada has improved its performance on both water indicators, reducing water withdrawals from 1990 to 2009 and improving water quality from 2008 to 2010.
Likewise, Canada’s performance on all three climate change and energy efficiency indicators has improved:
- GHG emissions per capita decreased by 4.7 per cent between 1990 and 2010
- energy intensity decreased by 19.8 per cent between 1990 and 2009
- the proportion of Canada’s electricity produced from low-emitting sources renewable and nuclear) increased from 72.3 per cent in 2000 to 77.5 per cent in 2011
Canada’s historical performance on the natural resource management indicators shows progress is being made to reduce the intensity of use of forest resources. Canada’s forest cover has remained fairly constant over the past two decades.
A declining Marine Trophic Index, however, suggests that Canada’s fish resources are still diminishing and that unsustainable fishing practices prevail.
Footnotes
1 Organisation for Economic Co-operation and Development, OECD Key Environmental Indicators 2007 (Paris: OECD, 2007).
2 Statistics Canada, Waste Management Industry Survey: Business and Government Sectors 2008 (Ottawa: Statistics Canada, 2010), Catalogue no. 16F0023X, 7.
3 Eutrophication is an increase in chemical nutrients in water that encourages the excessive growth and decay of plants, leading to a lower oxygen supply for fish and other animals.
4 Ecosystem services refer to the purification of air and water; detoxification and decomposition of wastes; regulation of climate; regeneration of soil fertility; storage, release, and distribution of carbon; cycling of nutrients; and transfer of energy.