
Economy

Stay up to date
Looking for the latest in economic planning? Create a CBoC account and sign up for email updates.
Key Messages
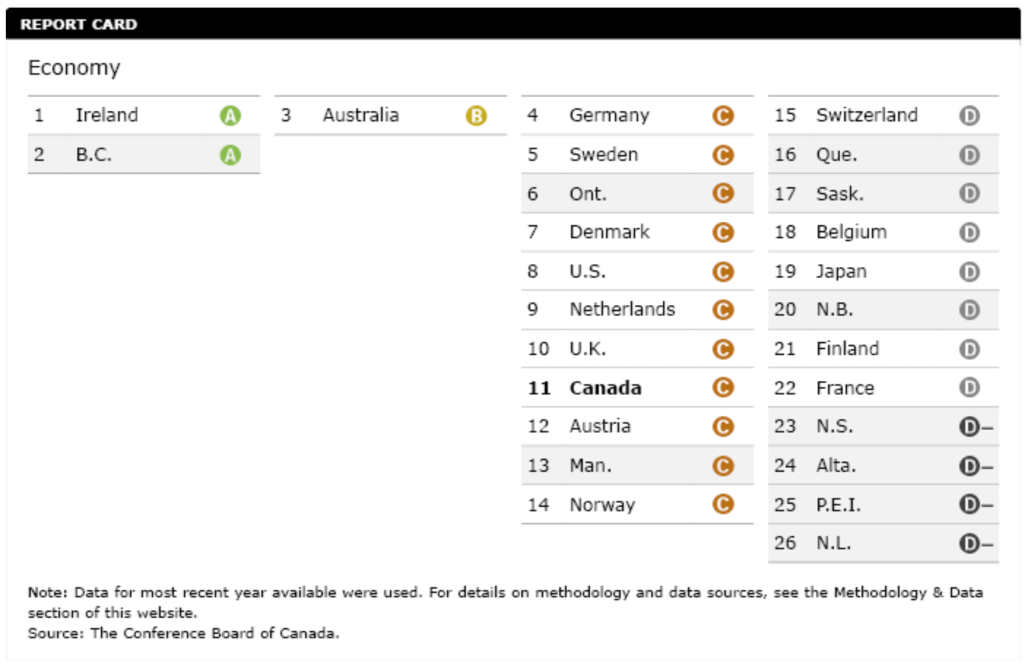
- British Columbia tops the provinces with an excellent overall A performance that ranks second only to Ireland.
- Ontario has worked its way up into second place among the provinces with strong growth over the past three years—the province ranks 6th among the 26 jurisdictions and gets a C grade.
- Resource-rich Alberta, Saskatchewan, and Newfoundland and Labrador have tumbled down the rankings as a result of recent sustained negative commodity shocks and now get D and D– grades, as do Quebec and the Maritime provinces.
- Overall, Canada gets a C and ranks 9th among 16 peer countries—a notable drop from the last report card when Canada earned a B and ranked 5th.
How is economic performance measured?
The Conference Board’s overarching goal is to measure quality of life for Canada, its provinces, and its peers. We ask two questions: Do Canadians have a high quality of life? Is it sustainable?
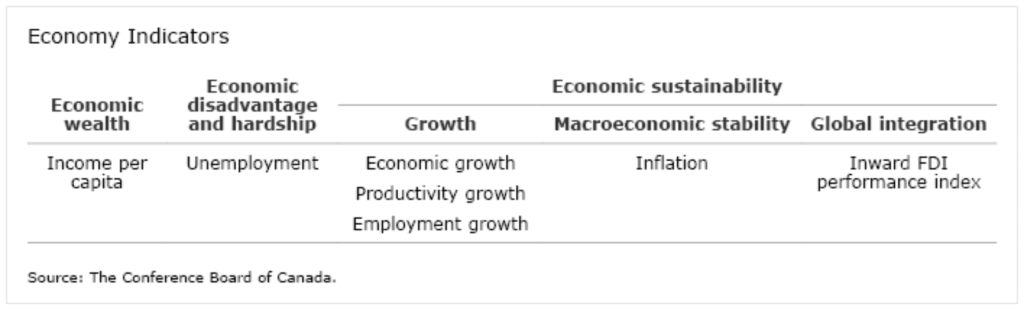
When measuring the economic aspect of quality of life, we consider three dimensions:
- economic wealth
- economic disadvantage and hardship
- economic sustainability
1. Economic Wealth
Economic wealth is captured by income per capita (gross domestic product per capita). Income per capita is closely linked to median incomes, and so reflects material living standards—that is, the capacity of Canadians to buy the goods and services needed to live, such as housing, food, and clothing. Income per capita is also indicative of the ability of a province or country to sustain living standards through public spending on education, health, and infrastructure, as well as through private and public savings that can be used to generate future income and to support future consumption. At the macro level, a province or country that is not generating enough income is hampered in what it can do in other areas, such as the environment and education.
2. Economic Disadvantage and Hardship
Economic disadvantage and hardship is measured by the unemployment rate. High unemployment hurts a province’s or country’s labour productivity and its gross domestic product (GDP) growth. High unemployment is also linked to elevated rates of poverty, homelessness, income inequality, crime, poor health outcomes, low self-esteem, and social exclusion.
3. Economic Sustainability
Economic sustainability is defined here as the ability of a province or country to sustain its prosperity into the future. Facets of economic sustainability include growth, macroeconomic stability, and global integration.
- Growth is represented by three indicators: economic growth, labour productivity growth, and employment growth.
- Economic growth is the increase in real (that is, inflation-adjusted) GDP. It is essential to sustaining living standards, since a province or country that has a relatively high GDP level today is not guaranteed that this level will be maintained.
- Productivity growth is the single most important determinant of a province’s or country’s long-term economic growth and per capita income; it is therefore the only sustainable way to improve standard of living. Productivity can be enhanced by finding more efficient and effective ways to yield goods and services so that more can be produced with the same amount of effort. Productivity can also be improved by producing higher-value-added products and services that are worth more in the marketplace.
- Employment growth is a driver of income per capita. It reflects the capacity of a province or country to absorb new workers joining the labour force and to use the labour resources available. A buoyant economy is one that is creating new jobs.
- Macroeconomic stability is represented by a proxy indicator: the inflation rate.
- The inflation rate reflects sustainability because rapidly rising prices erode the purchasing power of consumers; that is, inflation reduces the quantity of goods that can be purchased with a given amount of money. Deflation is also bad because it depresses consumption and overall activity. Periods of high inflation or deflation undermine the economy’s ability to sustain prosperity.
- Global integration is represented by the inward greenfield foreign direct investment (FDI) performance index.
- The inward greenfield FDI performance index measures a region’s share of global greenfield FDI relative to its share of global GDP. It captures a region’s relative success in attracting global greenfield FDI—that is, investment that expands an existing facility or creates a new facility. Ideally, we would benchmark total inward FDI, which includes data on mergers and acquisitions, but unfortunately, comparable data are not available for the provinces. Inward FDI encourages the diffusion of technology management know-how, as well as more efficient resource allocation. Subsidiaries acquire knowledge and technologies from their international parent. Domestic firms that interact with these subsidiaries also benefit from these transfers of technology and knowledge. Ultimately, inward FDI leads to higher productivity, improved quality of products, and increased competitiveness.
We assign grades to Canada, its provinces, and 15 peer countries on each of these seven indicators. We then calculate an overall grade on the economy report card for each province and country based on the aggregate performance on these seven indicators. For more details on how the grades are calculated, please visit the Methodology page.
The territories are not included in the overall economy report card because territorial data are not available for all seven indicators. However, we do report on territorial performance when comparable data are available.
What does the provincial economic report card look like?
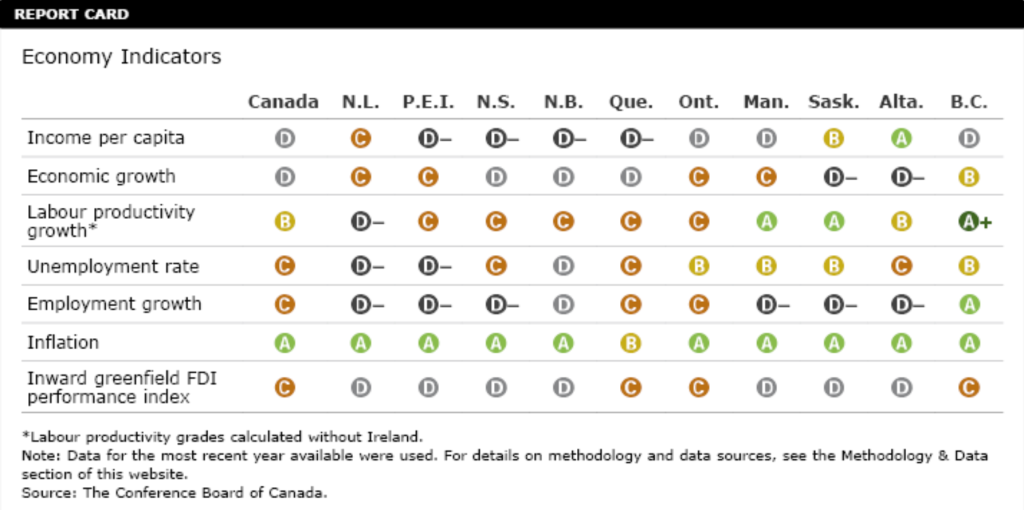
For each indicator, we calculate the A–B–C–D grade ranges by taking the difference between the best- and worst-performing countries and dividing it into four equal quarters. Jurisdictions that fall into the top quarter get an A grade; those in the second quarter get a B; in the third quarter, a C; and in the fourth quarter, a D. When assigning grades to the provinces, we also give an A+ to any province that does better than the top-performing peer country and a D– to any province that does worse than the poorest-performing peer country.
Ireland was excluded in the calculations of the A–B–C–D grade ranges for the rankings for labour productivity growth between 2011 and 2015 (the last five years of available data). The country recorded economic growth of 26 per cent in 2015, and because labour productivity measures the amount of GDP produced by each worker-hour in an economy, Ireland’s labour productivity growth skyrocketed to 22 per cent in that year. Given that Ireland’s 2015 growth is likely a statistical artifact (see labour productivity growth for details), the country was assigned an A+ grade but then omitted when calculating the letter grades for the provinces and peer countries on this indicator. This results in a much more reasonable distribution of grades that more accurately reflects the differences in performance among jurisdictions.
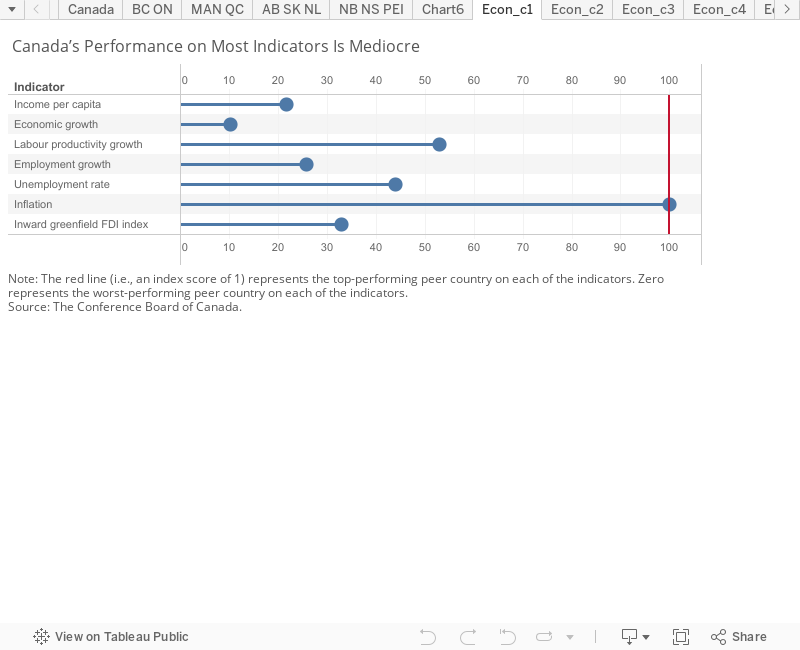
How does Canada perform overall?
Overall, Canada gets a C grade on the economy report card, ranking 9th out of the 16 peer countries. Canada’s strongest performance is on inflation, for which it gets an A for an inflation rate of 1.4 per cent in 2016.
Canada’s other area of strength on this year’s report card is labour productivity growth. With average annual increases in labour productivity of 1.0 per cent between 2011 and 2015, Canada ties Denmark for third among the peer countries, behind Ireland and Australia. Canada’s strong performance on labour productivity growth is good news, as Canada is typically a laggard on labour productivity compared with its peers. However, it should be stressed that Canada’s good ranking on productivity reflects weak performances abroad, as 1 per cent productivity growth is very modest.
Canada’s worst performances were on measures related to GDP. Since 2014, when the global prices of many commodities crashed, the Canadian economy has struggled to generate growth. Economic growth of 1.4 per cent in 2016 puts it in the back half of the peer countries, earning a D. Income per capita of US$42,346 (2010 prices and purchasing power parities) in 2016 was also unexceptional by international standards, earning Canada another D.
Canada is a C performer on unemployment, employment growth, and the inward greenfield FDI index. Canada’s poor economic growth had a knock-on effect on job creation, and so it finished ahead of just three other countries on employment growth, with just 0.7 per cent growth in 2016. As a result, the unemployment rate, previously a source of strength in rankings during the years following the financial crisis, has not declined as quickly in Canada as in other countries. In 2016, Canada’s unemployment rate was 7 per cent—the fifth highest rate among the 16 peer countries. And Canada’s greenfield FDI inflows relative to the size of its economy are still small compared with the best-performing peer countries. Canada ranks 6th among the 16 peer countries on the inward greenfield FDI index.
Which provinces top the standings?
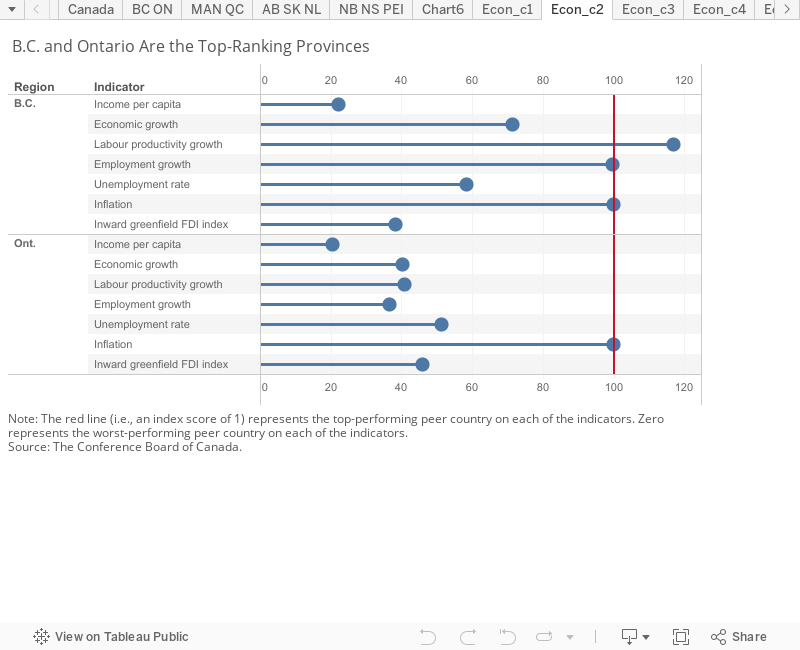
British Columbia and Ontario are the top-performing provinces in Canada, ranking 2nd and 6th among the 26 peer jurisdictions overall. Both B.C. and Ontario have benefited from booming housing markets, in Vancouver and Toronto respectively, and from strong demand for their exports in the United States.
British Columbia puts in a remarkable performance, ranking first in the country and second overall, behind only Ireland. Ireland and B.C. are the only comparator jurisdictions with A grades overall on the latest economy report card. While Ireland’s swift economic growth puts it out of reach of any other peer jurisdiction on any measure based on GDP, B.C. outperformed it on inflation, unemployment, and employment growth for a well-earned position atop the rest of the peer countries. B.C. ranks well ahead of the third-placed jurisdiction, B-ranked Australia.
The province outperformed all peer jurisdictions besides Ireland on labour productivity growth, with growth averaging 2.0 per cent between 2011 and 2015. B.C. also gets A grades on inflation and employment growth. At 3.2 per cent, the province is tied with Denmark for the highest employment growth in 2016.
B.C. gets B grades for its unemployment rate and economic growth, outperforming all other provinces on both measures. B.C.’s economic growth rate of 4.0 per cent in 20161 was second only to Ireland’s.
B.C.’s areas of relative weakness are the C grade it gets on the inward FDI performance index and the D grade it gets on income per capita. The province’s income per capita, while almost exactly equal to the Canadian average, is well behind that of Alberta, Saskatchewan, and Newfoundland and Labrador. B.C.’s inward FDI index of almost exactly 1.0 indicates that it is neither overperforming nor underperforming relative to its economic size when it comes to attracting FDI. The province ranks second in the country on this metric, behind Ontario, and sixth among all the comparator regions.
Ontario ranks 2nd overall among the provinces and 6th among the 26 comparator jurisdictions. The province earns just one A grade—for inflation, like almost all the provinces. But, like B.C., Ontario gets just one D grade, scoring one B and four Cs on the remaining indicators.
Although only four countries and one province place ahead of it, Ontario receives just a C grade overall because its performance is not strong compared with the top-ranking peer countries on many of the individual indicators. The province had economic growth of 2.7 per cent in 2016, the fourth highest growth rate among all the regions and the second highest growth rate in the country. Its C grade on this measure reflects top-ranking Ireland’s strong growth of 5.2 per cent that year. Similarly, Ontario is the top-performing province on the inward FDI index, ranking fourth overall after Ireland, the U.K., and Australia, but it nonetheless receives a C on this measure because its inward FDI index score is only about half that of first-place Ireland’s.
Despite getting a B grade for its 6.5 per cent unemployment in 2016, Ontario places just 14th among the 26 comparator regions. The province gets C grades on labour productivity growth and employment growth, ranking 14th and 12th respectively. Finally, Ontario gets a D on income per capita, ranking 16th out of 26.
How does the rest of the country do?
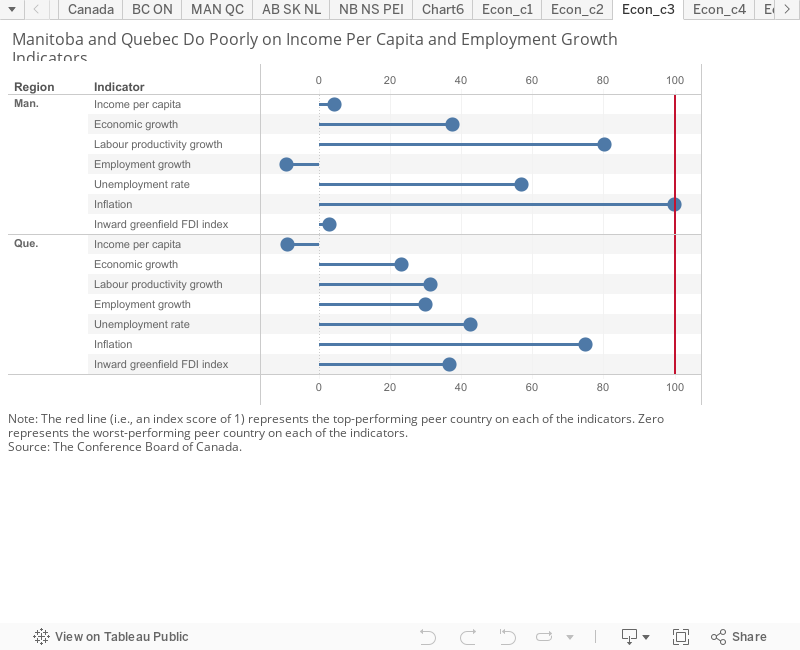
Outside B.C. and Ontario, there is less good news. No other province finishes higher than 13th overall, and Canadian provinces occupy the bottom four spots in the rankings. The next highest-ranking provinces after B.C. and Ontario are Manitoba, which earns a C overall, and Quebec, which earns a D.
Manitoba ranks 13th among the 26 comparator regions, just behind the Canadian average. In 2016, Manitoba’s economic growth of 2.6 per cent was third among the provinces, but it only earns a C because it falls well below the top-performing peer country, Ireland, whose GDP grew by 5.2 per cent. Manitoba gets a D on income per capita, ranking below the Canadian average and 20th overall. The province’s unemployment rate of 6.1 per cent in 2016 was better than the national average, earning it a B, but its employment growth was negative, earning it a D– for performing worse than the worst-performing peer country, as shown by its negative index score for employment growth in the chart below. Manitoba does poorly on the inward FDI index, scoring a D and ranking third-last.
On the positive side, the province’s average labour productivity growth was second in the country after B.C. and fourth among all the comparator jurisdictions, earning it its only A outside inflation.
Quebec ranks three spots behind Manitoba, in 16th place. The province gets four C grades, on labour productivity growth, unemployment, employment growth, and the inward FDI performance index. Quebec ranks below the national average on unemployment and labour productivity growth. Its employment growth, at 0.9 per cent, was better than the seven provinces that saw declines in employment in 2016.
Quebec is dragged down in the rankings by its low income per capita, ranking below the poorest-performing peer country, France, and scoring a D– grade. Also, it is the only province to score a B on inflation (its inflation rate of 0.7 in 2016 is below the lower bound of the Bank of Canada’s target range).
How do the resource-rich provinces do on this year’s economy report card?
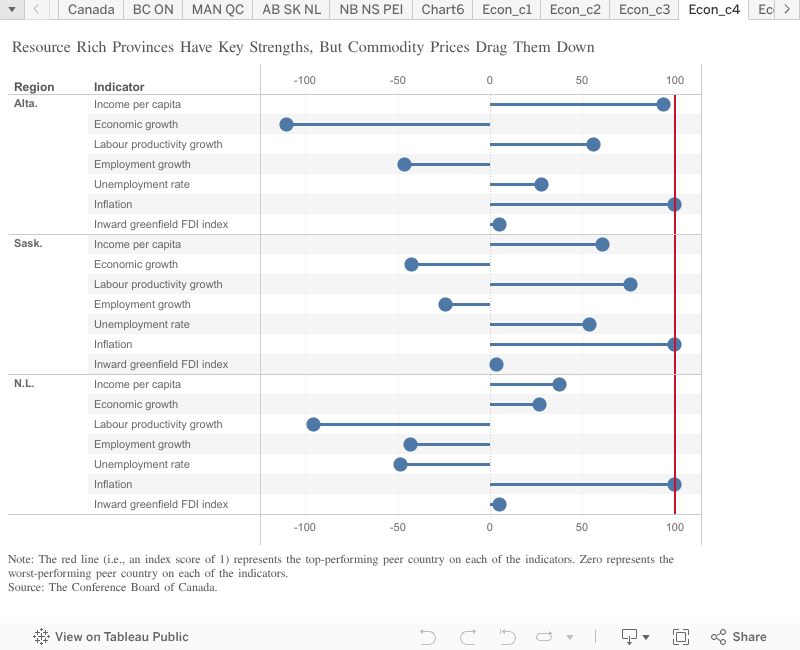
Alberta, Saskatchewan, and Newfoundland and Labrador have all plummeted in the rankings, dropping from being the top three A+ performers in the last economy report card (which was based on 2013 data) to scoring D or D– grades overall. The economies of all three provinces were badly hurt by the dramatic fall in commodity prices in 2014 and have suffered in the years since.
Saskatchewan ranks right behind Quebec in 17th place overall. It gets D– grades on economic growth and employment growth as a result of the commodities price crash and the resulting recession in the province. On economic growth, it ranked second-to-last among all jurisdictions, with a 0.8 per cent contraction in real GDP in 2016. Saskatchewan also had negative employment growth that year. The province does poorly on the inward FDI index as well, scoring a D grade and ranking 23rd among the 26 comparator regions.
Saskatchewan does do better on the remaining indicators though, scoring an A and ranking 5th overall on average labour productivity growth, and ranking 6th on income per capita, earning a B grade. The province gets a B on the unemployment rate, with 6.3 per cent unemployment in 2016. Like all the other provinces save Quebec, it scores an A on inflation.
Alberta ranks 24th among the 26 comparator regions. As in Saskatchewan, a commodity-price-driven recession resulted in poor performances on key indicators. Alberta gets a D– on economic growth, ranking last among all jurisdictions with a serious contraction in real GDP in 2016. It scores a D– on employment growth, ranking second-to-last, ahead of only Prince Edward Island—a big turnaround from years in which its job market attracted Canadians from across the country. Alberta gets a D on the inward FDI index and ranks 21st among the 26 regions, also a turnaround from when foreign oil companies were lining up to invest in the province.
Alberta still does well on some indicators, though. The province’s income per capita remains high and earns it an A, ranking third behind Ireland and Norway. Alberta also ranks above the national average on labour productivity growth and gets a B grade. The province’s unemployment rate has risen recently, earning it a C, but it is still well below the rates in the Atlantic provinces. Like most provinces, Alberta earns an A for its inflation rate in 2016.
Newfoundland and Labrador ranks last among all the comparator jurisdictions. Like most provinces, Newfoundland and Labrador gets an A on inflation. Its income per capita and economic growth are both above the Canadian average, earning it two Cs. Its economic growth in 2016 was surprisingly high at 2.1 per cent, driven by the construction of the Hebron oil platform.
But Newfoundland and Labrador does poorly on all the other indicators. It scores a D on the inward FDI performance index. It gets D– grades for ranking below the worst-ranking peer country on labour productivity growth, unemployment, and employment growth. The province ranks last overall on two of these indicators (labour productivity growth and the unemployment rate).
How do the Maritime provinces do?
The Maritime provinces rank near the bottom of the pack, placing between 20th and 25th among the 26 comparator regions.
New Brunswick ranks ahead of the other Maritime provinces, in 20th place overall. But the province still earns just two grades above D: an A on inflation and a C on average labour productivity growth. New Brunswick gets D grades on economic growth, unemployment, employment growth, and the inward FDI index. Its economic growth was 7th among the provinces (1.6 per cent), and it had the fourth highest unemployment rate among all 26 jurisdictions (9.5 per cent) in 2016. It did better than six other provinces on employment growth, but still saw employment contract by 0.1 per cent. And although its inward greenfield FDI index puts it in the top half of comparator jurisdictions, it is so far below first-place Ireland that it still gets a D. Finally, the province scores its lowest grade, a D–, on income per capita for ranking below the poorest-performing peer country on this measure, France.
Nova Scotia ranks 23rd out of the 26 comparator regions. Like its neighbour, New Brunswick, it gets an A on inflation and a C on labour productivity growth. Nova Scotia also gets a C for unemployment and a D or D– on all the other indicators. Nova Scotia’s unemployment figures are better than New Brunswick’s, but it ranks below its neighbour on every other indicator.
P.E.I. ranks second-last overall, ahead of only Newfoundland and Labrador. Like most provinces, P.E.I. scores an A on inflation. The province gets middling C grades on economic growth and labour productivity growth, but otherwise it ties bottom-ranked Newfoundland and Labrador with the most D– grades in the country. P.E.I.’s income per capita of US$31,947 (2010 prices and purchasing power parities) and its –2.3 per cent employment growth in 2016 were both the worst of any jurisdiction. P.E.I. also has the second highest unemployment rate among all the jurisdictions in 2016, at 10.7 per cent, and ties Nova Scotia for the second lowest average labour productivity growth among the provinces, at 0.6 per cent.
What about the territories?
The territories are not included in the overall rankings because data are not available for all of the indicators in the economy report card. However, we do provide a summary of territorial performance when data are available.
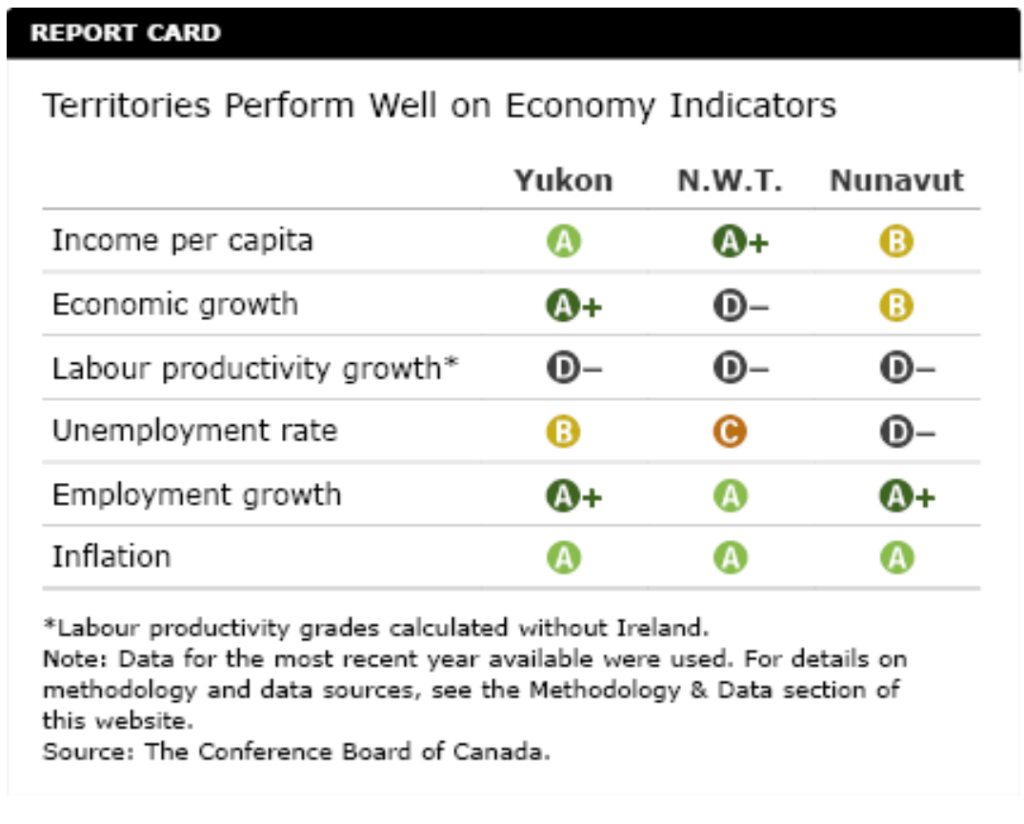
The territories do relatively well on many of the economic indicators, with Yukon, in particular, putting in a strong performance.
Yukon gets an A or A+ on four of the six indicators for which territorial data are available. The territory gets an A for its income per capita, which at US$56,571 (2010 prices and purchasing power parities) is well above the Canadian average of US$42,346. Yukon also gets an A+ for the highest economic growth of any province or territory in 2016, an impressive 8.3 per cent, and an A+ grade for its employment growth of 4.1 per cent. Like the other two territories, and all the provinces except Quebec, it scores an A on inflation. Yukon gets a B grade on unemployment, but its unemployment rate was the lowest in the country in 2016, at 5.6 per cent.
The only indicator on which Yukon does poorly is labour productivity growth; like the other territories, Yukon’s labour productivity declined over the last five years, placing it among the D– performers.
The Northwest Territories gets an A or an A+ on three indicators. On both employment growth and inflation, the territory is an A performer. N.W.T.’s income per capita of US$88,719 (2010 prices and PPPs) is higher than any province or peer country we include in our rankings, earning it an A+. Per capita income in the N.W.T. has been well above that of every Canadian province since the beginning of the 2000s, when data on the territory as separate from Nunavut became available, and although some of this wealth does not remain in the territory, it still has the highest median income in the country. N.W.T.’s strong resource base, including diamonds, oil, and gas, is the catalyst for its high income per capita.
The territory doesn’t fare well on the other three indicators, though. Its economic growth of 0.4 per cent in 2016 and its five-year average labour productivity growth of –4.2 per cent place it among the D– performers on both indicators. N.W.T.’s unemployment rate, at 7.4 per cent in 2016, places the territory among the C performers.
Nunavut doesn’t do as well as the other territories overall, but still ranks above the national average on a number of indicators. The territory’s astonishing employment growth of 6.3 per cent in 2016 was higher than that of any other comparator jurisdiction, earning it an A+. Like most other provinces and territories, it gets an A on inflation. Nunavut’s income per capita of US$51,993 (2010 prices and PPPs) is below that of the other two territories but still well above the Canadian average, earning it a B. Its economic growth rate of 3.9 per cent in 2016 was also well above the Canadian average but not as high as the top international performer, so the territory is among the B performers.
Nunavut does particularly poorly on two indicators. It gets D– grades both for its average labour productivity growth, which was negative between 2011 and 2015, and its unemployment rate, which at 14.9 per cent is higher than any other province, territory, or peer country. Two key factors contribute to the high unemployment rate in Nunavut. First, many jobs are filled by workers from the South who do not take up residency in the territory and are therefore not counted in territorial employment statistics. Second, the increase in jobs due to economic expansion has encouraged more Nunavummiut to enter the labour force. As not all new entrants find jobs, the number of unemployed increases.
Why do the resource-rich provinces do so poorly on this year’s report card?
Just a few years ago, the provincial rankings looked much different than they do today. Alberta, Saskatchewan, and Newfoundland and Labrador were the top-ranking provinces, ahead of all the provinces and peer countries, earning A+ overall grades. This year, all three of these resource-rich provinces have tumbled down the rankings and get D or D– grades overall on the economy report card. What caused such a dramatic change in their fortunes?
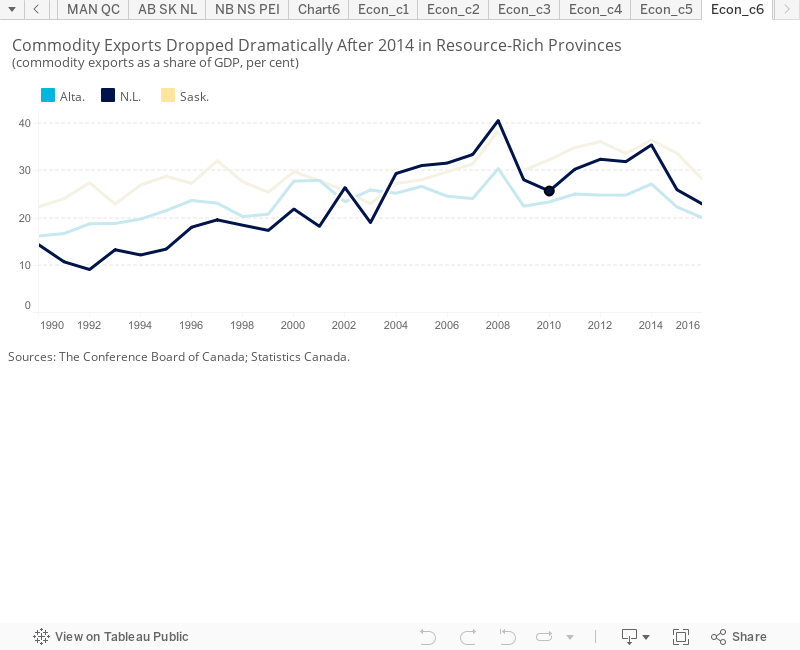
The explanation can largely be traced to one event: the commodities price shock that began in 2014. During this period, the global prices of every major commodity declined precipitously because of oversupply and weak demand. From its peak in 2014 to its nadir in early 2016, the price of oil fell by 71 per cent; the price of natural gas fell by 57 per cent; the price of wheat, by more than 30 per cent; zinc, by 35 per cent; nickel, 57 per cent; iron, 63 per cent.2
The boom years in Alberta, Saskatchewan, and Newfoundland and Labrador were powered by high demand and high prices for commodity exports. In 2014, international exports of primary commodities (energy products; metal ores and non-metallic minerals; farm, fishing, and intermediate food products; and forestry products and building packaging materials) made up 36 per cent of GDP in N.L., 37 per cent of GDP in Saskatchewan, and 27 per cent of GDP in Alberta. By 2016, those figures had fallen to 23 per cent, 28 per cent, and 20 per cent, respectively.3 It is therefore no surprise that these provinces have struggled over the past two years.
Newfoundland and Labrador, Saskatchewan, and Alberta still have some significant strengths. All three still have high incomes per capita, and Alberta and Saskatchewan still do well on labour productivity growth.
But all three provinces are dragged down by abysmal performance on the inward FDI index, employment growth, and economic growth—results that are directly related to the commodities price crash.
Commodity prices have already begun a slow recovery; as this recovery continues, it will stimulate economic growth and investment and create job opportunities in these provinces, allowing them to move up the rankings again.
Provincial and Territorial Ranking
Will B.C. and Ontario remain at the top of the rankings?
British Columbia and Ontario are the standout performers on this year’s economy report card. B.C.’s performance in particular was excellent, coming close to the top international performers on economic growth, labour productivity growth, and employment growth. Ontario also put in a consistent performance across many indicators to earn its spot in the top six overall. Can we expect to see more strong performances from B.C. and Ontario?
Caution is certainly in order, as there are some important risks facing these provinces over the next year. Both provinces’ solid performances over the past two years have been built on booming housing markets and on strong demand for their exports in the United States. Both of those economic drivers are now facing threats. Although rapidly growing housing markets may be good for economic figures, they cause hardship for families who are being priced out of the cities they live in. The B.C. and Vancouver governments took action in 2016 to rein in the housing sector, and similar measures were announced by the Ontario government in early 2017. If these policies are successful at cooling housing markets, this will have a knock-on effect on both provinces’ economic growth in 2017 and beyond.
Another threat to economic growth is south of the border. U.S. President Donald Trump won the 2016 election after promising repeatedly to get tough on trading partners, promote jobs in the U.S., and renegotiate the North American Free Trade Agreement. At the time of writing, the full extent of the policy actions the administration will take on trade is not yet clear, but any measures that restrict the flow of goods between Canada and the U.S. will disrupt exporters in B.C. and Ontario. Ontario may be spared the worst of Trump’s wrath, because its key auto sector is so tightly integrated with the American auto sector that restricting trade would hurt American manufacturers as much as Canadian ones. But B.C. may not be as fortunate: its major export to the U.S. is forestry products, which have been in high demand thanks to strong growth in the U.S. housing sector, but which have been the subject of a long-standing trade dispute between the two countries. The Trump administration announced in early 2017 that it will impose duties on Canadian softwood lumber imports, and unless a new agreement is reached on this file, British Columbian lumber producers will lose market share in the U.S., harming jobs and growth in the province.
What explains the consistently poor performance of the Maritime provinces?
The Atlantic provinces nearly earned a clean sweep of the bottom of the rankings this year. Newfoundland and Labrador is something of an outlier in the region, and it dropped from the top of the rankings to the bottom as a result of the commodities price crash. But the Maritime provinces of New Brunswick, Nova Scotia, and Prince Edward Island have long lagged on rankings of income per capita, unemployment, and FDI. In the last How Canada Performs economy report card released in 2014, P.E.I. received an overall B, but Nova Scotia and New Brunswick both got D grades. All three provinces are now D– performers. Why is the region struggling so much?
There is no single explanation. The region is much less urbanized than the rest of the country: 46 per cent of the population live in a rural area compared with just 17 per cent in the rest of the country. Those rural regions tend to depend on seasonal jobs, like agriculture or fishing, but the Maritimes lack jobs for workers during the off-season. As a result, many people in the region work only part of the year, a significant contributor to low income per capita and high unemployment rates.
The Maritime provinces also fail to attract much inward FDI, in part because of their small populations and rural character, and this lack of investment hurts their labour productivity.
These provinces have also seen many people of working age leave the region for other parts of the country with more economic opportunity. Accordingly, the region is already feeling the impact of an aging population. The population that remains has a higher ratio of dependents than the rest of the country and so requires proportionately more spending on public services like health care. Higher demands and a smaller tax base place difficult budgetary constraints on the region’s governments and therefore restrict their ability to contribute more to education and investment.
What can be done to improve Canada’s performance going forward?
Productivity is the single most important determinant of a country’s prosperity over the longer term. Countries and provinces that are innovative and able to adapt to the ebb and flow of the new global economy boast higher productivity and thus a superior standard of living. Unfortunately, Canada has long lagged many of its peers when it comes to labour productivity levels and growth. In 2015, each worker-hour in Canada produced US$48.55 of output (2010 prices and purchasing power parities); each worker-hour in the United States produced US$62.89, nearly one-third more.
Low productivity levels present an enormous challenge for future economic prosperity. Improving labour productivity is not about working longer or harder; it’s about working smarter. It’s about finding more efficient and effective ways to produce goods and services so that more can be produced with the same amount of effort. It’s also about producing higher-value-added products and services that are more valued in the marketplace.
The onus of improving productivity lies not just with governments, but also with individual firms and their management and ownership. There is no silver bullet for improving productivity, but common strategies include investing more in machinery and equipment (particularly information and communications technology equipment), fostering innovation, and attracting more FDI.
Many provinces had strong labour productivity growth over the last five years, and all except Newfoundland and Labrador closed some of the gap with the United States. This progress is welcome news and a good first step, but it must continue if Canada is to improve its overall performance and relative ranking. It is therefore imperative that Canada and its provinces focus on initiatives that promote labour productivity growth. Moreover, while Canada’s productivity growth was favourable based on international comparisons, the absolute performance has been weak, as 1.0 per cent labour productivity growth is modest. Indeed, with an aging population and slowing labour force growth, this pace of productivity expansion is only consistent with the Canadian economy growing at a trend rate of around 1.7 per cent. This rate of growth will make it difficult for governments to deliver on social priorities, like health care outlays with an aging population.
Footnotes
1 Real GDP growth rates in the report card are for GDP at market prices, to allow comparison with the international data source. Statistics Canada data on 2016 provincial GDP at market prices will not be released until November, 2017. As a result, 2016 GDP data for the provinces is from the Conference Board of Canada’s latest forecast of the provincial economies, produced in May 2017. The 2016 provincial GDP at market prices is based on Statistics Canada’s 2016 real GDP at basic prices.
2 Conference Board of Canada calculations based on World Bank Commodity Prices.
3 Conference Board of Canada calculations based on Statistics Canada CANSIM table 228-0060, Merchandise Imports and Domestic Exports, Customs-Based, by North American Product Classification System (NAPCS), Canada, Provinces, and Territories.