
Income Per Capita

Stay up to date
Looking for the latest in economic planning? Create a CBoC account and sign up for email updates.
Key Messages
- Alberta earns an A grade with income per capita almost identical to the top peer country, Ireland.
- Four provinces get D– grades for incomes per capita lower than the worst-performing peer country, France.
- Overall, Canada ranks 11th among the 16 peer countries and gets a D on income per capita.
What is income per capita?
Income per capita, calculated as gross domestic product per capita, is the most frequently used statistic for comparing economic well-being across countries. GDP is the total value of the goods and services produced in a country or region in a given time period.
This report card indicator is measured per capita, because a country’s total income may rise as its population increases even though there may have been no improvement in the income level of the average citizen. To compare per capita income over time in real terms, the indicator is also adjusted to remove the effects of price changes.
How do the provinces fare relative to Canada’s international peers?
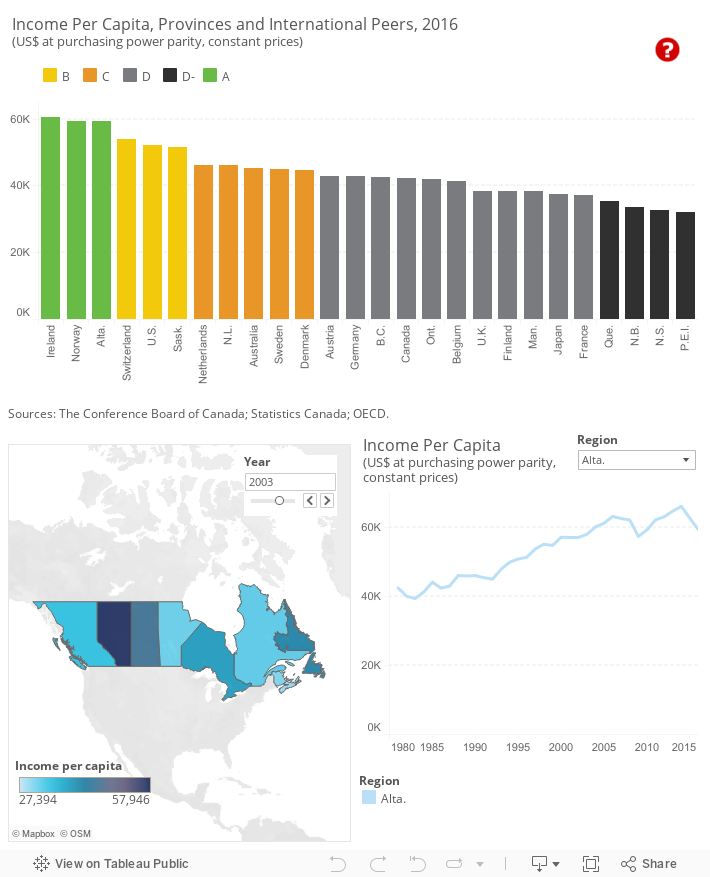
Alberta is once again the top-ranking province, earning an A grade for its GDP per capita of US$59,249 in 2016 (all numbers are in 2010 US$ at constant purchasing power parity) and placing third overall, behind Ireland (US$60,610) and Norway (US$59,366).
Norway is a perennial chart-topper on this measure thanks to its oil wealth; it has been an A performer on income per capita in every year since 1982. Ireland is the relative newcomer at the top of the charts. It was a D performer in every year from 1970 to 1999, but since the turn of the millennium it has rapidly risen up the ranks. Ireland has benefited from its favourable tax treatment of foreign companies locating in the country, and its rapid economic growth beginning in the 1990s earned it comparisons to fast-growing Asian “tiger” economies and the nickname “Celtic Tiger.”
Saskatchewan is the second-highest-ranking province. Its income per capita of US$51,499 in 2016 is comparable to the United States’ (US$52,066) and well above the Canadian average, earning it a B grade. Newfoundland and Labrador also does better than the national average, with per capita income of US$46,088, earning the province a C grade.
Overall, Canada ranks 11th among the 16 peer countries and gets a D with income per capita of US$42,346 in 2016.
B.C. and Ontario are both almost exactly at the Canadian average, with incomes per capita of US$42,454 and US$42,037, respectively. Both provinces score D grades. Manitoba also scores a D grade, with income per capita of US$38,268. That is comparable to Finland (US$38,401).
Quebec (US$35,213), New Brunswick (US$33,582), Nova Scotia (US$32,531), and P.E.I. (US$31,947) bring up the rear. All four provinces have incomes per capita below that of the lowest-ranking peer country, France (US$37,272), and so earn D– grades.
How do the provinces perform on income per capita relative to each other?
Alberta, Saskatchewan, and Newfoundland and Labrador have retained their positions as the top-ranking Canadian provinces; however, all three have faced significant economic difficulties over the past couple of years. The economies of all three provinces depend on exports of commodities like oil and metals. But in 2014, the global price of every major commodity began a precipitous decline, significantly reducing these provinces’ earnings from their natural resources. And partly because of the falling value of commodities, the value of the Canadian dollar simultaneously began to fall, increasing the cost of imported goods.
The effects of these changes are clearly reflected in the resource-rich provinces’ incomes per capita. From their peaks before the commodities price crash, Alberta’s GDP per head has declined by US$6,800 (all numbers are in constant 2010 prices at purchasing power parity), Saskatchewan’s has declined by US$2,500, and Newfoundland and Labrador’s has declined by US$650. Nonetheless, they remain ahead of the rest of the provinces when it comes to income per capita. Because of the capital intensity of extracting oil in the province, many of the investments and jobs in that sector cannot easily leave, and so not all the progress of the boom years has been lost.
In the middle of the Canadian rankings are the comparatively more diversified economies of B.C., Manitoba, Ontario, and Quebec. Although these provinces did not see growth as fast as the oil-rich provinces in the 2000s, they also have not suffered painful contractions over the last two years.
Finally, bringing up the rear on GDP per capita are the Maritime provinces. This region suffers from an aging population that constrains GDP growth and weak labour markets that constrain wages and salaries.
What is the connection between productivity and per capita income?
The most important determinant of a country’s per capita income, over the longer term, is productivity—both its level and its growth. Why? Because there is no limit to productivity growth. There is a limit to how many hours in a day employees can work, how low the unemployment rate can go on a sustained basis, how high the labour force participation rate can rise, and how large the proportion of working-age people in the total population can be. But innovation and technological change can sustain productivity growth indefinitely, driving economic growth over time.
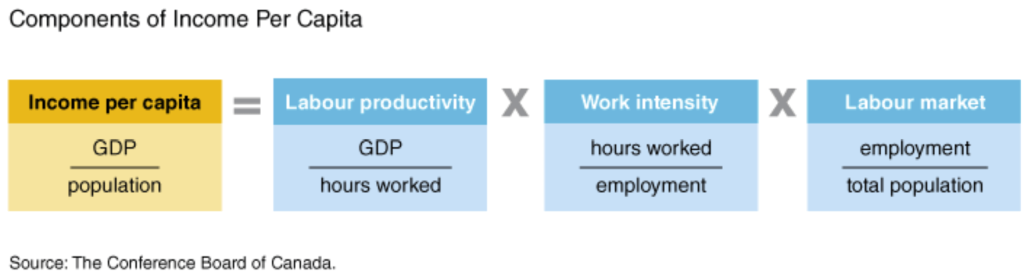
In the equation below, labour productivity is the only component with no upper limit. Therefore, improving productivity is the only sustainable way to reduce the sizable gap between provincial and U.S. income per capita.
Why do most of the provinces perform poorly on income per capita relative to the United States?
To understand the differences in income per capita among the provinces and peer countries, we need to look at the equation in the previous section and determine which component of income per capita is causing the income gap.
The equation illustrates how income per capita can be broken down into three components:
- Labour productivity is defined as GDP per hour worked. It measures the economic value produced by the average employee.
- Work intensity is defined as the average number of hours worked per employee.
- Labour market is defined as the share of employees in the overall population. It is affected by three factors:
- the ability of the economy to create jobs
- the demographic profile—what proportion of the population is of working age and therefore potentially able to work
- the proportion of the working-age population that actually joins the labour force
The table lists the actual dollar amount that each component contributed to the income gap in 2015 (the most recent year for which data on work intensity are available). In Ontario, for example, income per capita was US$41,485 in 2015, while the U.S. had an income per capita of US$51,592, meaning the income gap was US$10,107. Lower labour productivity accounted for US$12,310 of that gap, and the fact that the average Ontarian worker worked fewer hours in a year than their U.S. counterparts added another US$1,396 to the gap. Luckily, however, Ontario had a higher employment rate, a higher labour participation rate, and a more favourable demographic profile. These labour market components combined reduced the income gap by US$3,599.
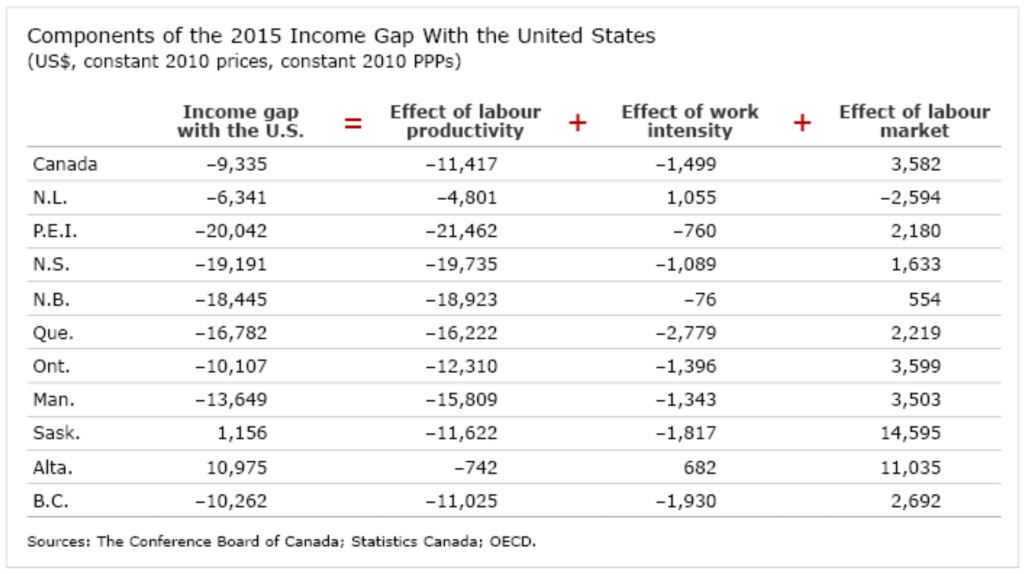
Two provinces had higher per capita incomes than the U.S. in 2015: Alberta and Saskatchewan. Alberta’s labour productivity and work intensity were very similar to the U.S., so its higher income per capita came thanks to a much higher employment rate. Saskatchewan was well behind the U.S. on labour productivity and work intensity, but its labour market likewise allowed it to close the gap.
Overall, here’s how the three components of income per capita affected the income gap with the United States:
- In all provinces, lower labour productivity accounted for the greatest share of the income gap with the United States in 2015. The negative effect was strongest in P.E.I., where it accounted for US$21,462 of the gap, and lowest in Alberta, where it accounted for only US$742.
- The effect of work intensity increased the income gap in all provinces but Alberta and Newfoundland and Labrador. The lower hours worked in the remaining provinces could reflect a decision to work fewer hours and/or the inability of the provincial economy to create enough demand for workers to work more hours. Quebec, where workers average slightly less than 32 hours per week, had the lowest work intensity. Newfoundland and Labrador, with an average work week of nearly 35 hours, had the highest.
- The effects of the labour market on provincial income gaps were mostly positive, reducing the income gap in all provinces but Newfoundland and Labrador.
- The ability to create jobs was uneven. The ratio of employment to the labour force was lower than the U.S. ratio in five provinces (Newfoundland and Labrador, P.E.I., Nova Scotia, New Brunswick, and Quebec) and higher in the remaining five provinces. The positive effect was particularly significant in Manitoba and Saskatchewan, where the unemployment rates are low.
- The demographic profile helped to reduce the income gap in every province but Prince Edward Island. This means that the percentage of the population that is of working age (and therefore able to contribute to the creation of products and services that increase GDP) is higher in all provinces than in the United States.
- In all provinces, the effect of higher labour force participation relative to the U.S. helped to reduce the income gap.
How have the provinces’ grades on income per capita improved over time?
Some of the provinces have managed to improve their grades on income per capita over the past few decades. Until the early 2000s, Newfoundland and Labrador had not earned above a D grade. However, development of the province’s oil reserves allowed it to boost its income per capita enough to earn C and B grades in the 2000s and 2010s. By comparison, none of the other Atlantic provinces have earned a grade above D since Nova Scotia got a C in 1986.
The resource-rich Prairie provinces have for the most part seen little change over time in their grades on income per capita. Alberta has been an A+ performer in all but two years since 1981, and Saskatchewan has scored a B in every year but five.
Manitoba, on the other hand, has seen a decline in its scores since the 1980s. It scored C grades until 1989, but since then it has scored exclusively D and D– grades. B.C. has similarly seen a decline over time. It received mostly B grades in the 1980s, mostly Cs in the early 1990s, and Ds or D–s in every year since 1995.
Ontario’s grade on per capita income has gradually declined since the early 1980s, reflecting the changing fortunes of the province’s economy. The province earned mostly B grades in the 1980s, mostly Cs in the 1990s, and only Ds since 2003. Ontario’s income per capita since 2007 has suffered from weakness in the province’s manufacturing sector that reflects weak growth in U.S. demand (the main destination for Ontario manufacturing exports) and competitiveness challenges, including a strong Canadian dollar until the commodity correction in 2014.
Quebec too has suffered a decline in performance on this indicator since the 1980s, when it earned C grades every year. The province has now been a D– performer every year since 1996. The province’s economy has been afflicted by the same factors affecting the Ontario economy, but other factors have also dragged down its grades on income per capita. Investor uncertainty has been fed by the on-again, off-again political debate and two referendums, which have hurt investment and innovation and dragged down overall productivity growth and per capita income since the mid-1990s.
What about the territories?
The territories all have income per capita well above the Canadian average, and the Northwest Territories has had income per capita above any Canadian province since it split from Nunavut in 1999. The Northwest Territories’ strong resource base—including diamonds, oil, and gas—and its remoteness and consequent wage boost due to difficulty in recruitment are the catalysts for the strong results. Its GDP per capita in 2016 was US$88,719, higher than any other OECD country, earning the territory an A+.
Yukon’s performance also stands out. Its per capita income is below the Northwest Territories but has been above that of all provinces except Alberta and Saskatchewan since the mid-1980s. In 2016, Yukon was an A performer with a GDP per capita of US$56,571.
Nunavut’s economy is not as developed as that of the other two territories and so it has a lower income per capita. It is still high by Canadian standards, however, beating the Canadian average in every year since 2008. For 2016, Nunavut’s GDP per capita was US$51,993, earning it a B.
Despite the territories’ high rankings on this indicator, there are still socio-economic problems and low incomes in some areas. This is particularly true when skill shortages lead to the underemployment of locals and the hiring of southerners to fill positions.
The territories are not included in the overall rankings because data are not available for all the indicators in the economy report card. The Conference Board is, however, committed to including the territories in our analysis, and so we provide information on territorial performance when data are available, such as for income per capita.
The Conference Board of Canada produces a biannual Territorial Outlook report that examines the economic and fiscal outlook for each of the territories, including output by industry, labour market conditions, and the demographic make-up of each territory. The Territorial Outlook can be accessed online through e-Library and for clients subscribing to e-Data.
Research on issues affecting the territories is also produced by the Centre for the North, a Conference Board initiative that began in 2009.
Why do we focus on per capita income?
Many economists and other analysts have pointed out the shortcomings of income per capita as a measure of well-being and have argued we should focus instead on measuring the things that really matter, like happiness. The 2015 Nobel Prize in Economics was awarded to an economist, Angus Deaton, who has spent much of his career focusing on the study of happiness and well-being.
But it is one thing to argue that a flourishing country must be built on more than just wealth; it is another to argue that wealth does not contribute to well-being. There are still good reasons to look closely at GDP. As Deaton points out, although it may not be of much interest on its own, GDP per capita correlates well with the things we do care about: self-reported life satisfaction ratings,1 the percentage of the population experiencing “happiness,”2 life expectancy,3 and declines in infant mortality.4
Moreover, GDP is easily comparable between jurisdictions. The same cannot be said of some of the alternative measures of well-being. Self-reported happiness scores, in particular, seem to depend as much on cultural norms as on actual well-being. As Deaton puts it, “In the United States, the pursuit of happiness is one of the unalienable rights enumerated in the Declaration of Independence, yet in the Calvinist Scottish village in which I grew up, such a pursuit would have been seen as indicating a serious weakness of character.”5
Per capita income is not the only statistic we need to look at, however. Although it works well to give a general sense of a country’s or province’s level of well-being, we must be careful in using it to draw conclusions about overall quality of life. For instance, Canada’s provinces (except Alberta) all have a lower per capita income than the United States. Yet many would make the case that quality of life is superior in Canada, despite the lower income per capita. For instance, Canada’s per capita homicide rate is far lower than that of the U.S., and the health care system, while far from perfect, provides universal coverage for Canadians. Canadians live longer lives, and have lower rates of infant mortality, than their American neighbours. As a result, despite its lower per capita in come, Canada typically outperforms the U.S. on rankings of happines6 and quality of life.7
How can the provinces increase their per capita income?
The best way to increase per capita income is to boost productivity. For all the provinces, this involves fostering innovation, investing more in machinery and equipment, and attracting more foreign direct investment. As well, a greater emphasis on advanced educational attainment, lifelong learning, and workplace skills training could also help boost productivity and lift per capita income.
Footnotes
1 Angus Deaton, The Great Escape (Princeton, N.J.: Princeton University Press, 2013), 30.
2 Ibid., 60.
3 Ibid., 42.
4 Ibid., 118.
5 Ibid., 55.
6 UN World Happiness Report 2017.
7 The Economist, The Lottery of Life: Where to Be Born in 2013, November 21, 2012; OECD Better Life Index 2016.