
Employment Growth
Key Messages
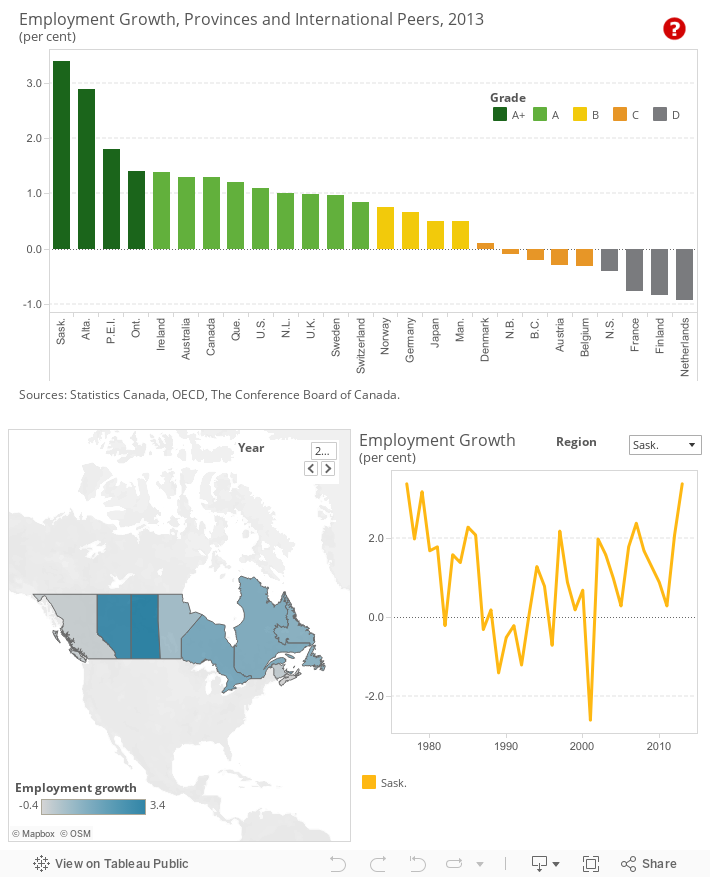
- Saskatchewan, Alberta, P.E.I., and Ontario earn “A+” grades, with higher employment growth in 2013 than the top international performer.
- Canada’s high ranking for the employment indicator reflects, in part, the fact that it emerged from the 2008–09 recession with minimal relative job loss.
- To maintain strong employment growth in the future, the Prairie provinces must address serious supply-side constraints on production.
Putting employment growth in context
Employment growth has been weak for developed countries since the end of the 2008–09 recession. History reveals that economic recoveries take longer after a financial crisis than after other types of crises (e.g., fiscal crises, oil shocks), because banks curtail loans in an attempt to get their balance sheets back in order. At the same time, households hold back on spending to reduce debt burdens, while governments squeeze spending to lower fiscal deficits that soared as they provided fiscal stimulus to kick-start economic activity during the recession.
Who is at the head of the class?
Saskatchewan, Alberta, P.E.I., and Ontario come out on top, with “A+” grades and with higher employment growth than the top international performer in 2013. While this ranking reflects the relative strength of the Canadian economy compared with other developed countries, it also highlights how poorly the economies of these other countries have performed. Canada’s overall job growth of 1.3 per cent in 2013 is modest by historical standards, but it is one of the top-ranked peer countries, scoring an “A” grade, because of the ongoing economic troubles in Europe and the weak recovery in the U.S. economy.
Quebec and Newfoundland and Labrador also rank high on employment growth, both scoring “A” grades. Like Saskatchewan and Alberta, Newfoundland and Labrador’s economy is boosted by its resource sector.
Australia earns an “A” grade, as its economy benefited from the high price of commodities and its close trade linkages to the Chinese economy. Ireland’s ranking is explained by the pickup in economic activity and job creation that generally occurs following a steep recession. While Ireland, like most eurozone countries, experienced a devastating downturn as a result of the bursting of a property market bubble, its recovery has been on a faster track than troubled members such as Spain, France, and Greece. As a result, Ireland’s labour market is recovering more rapidly and generating positive growth, in sharp contrast with France, for instance, which receives a “D” grade for 2013.
The only other country in the eurozone to perform relatively well on this indicator is Germany, which scores a “B” grade. Germany continues to have the strongest economy in central Europe thanks to the labour market reforms that the government implemented over a decade ago, including tougher eligibility requirements for unemployment insurance. These reforms enabled the German economy to continue to generate new jobs even during the height of the global recession.
Which provinces rank poorly on employment growth compared with international peers?
New Brunswick and British Columbia receive “C” grades and Nova Scotia receives a “D” for employment growth in 2013. These provinces have the dubious distinction of being in the same group as some of the troubled eurozone countries.
The extent of damage to the eurozone is apparent in the rankings. The countries that receive “C” or “D” grades are all from Europe, which has been mired in a severe recession as a result of tough austerity measures designed to bring deficits under control. Even Finland, a eurozone country with a fairly strong economy, could not escape the effects of the severe recession in Europe: it gets a “D” grade for employment growth in 2013.
How do the provinces perform relative to each other?
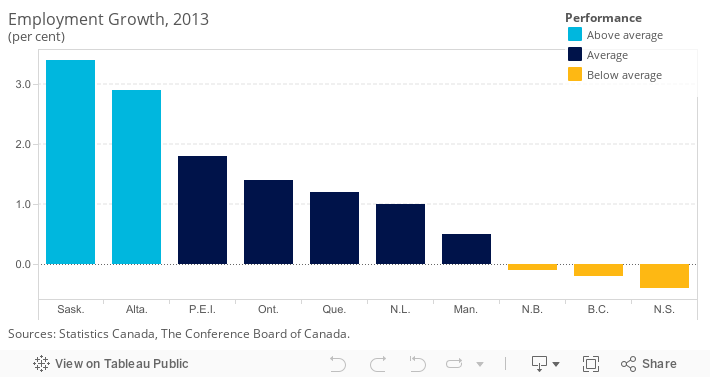
In addition to ranking the provinces against Canada’s international peers, the provinces have been compared with each other and placed into three categories: “above average,” “average,” and “below average.” 1 Saskatchewan and Alberta are considered above average on employment growth, recorded job growth of around 3 per cent or higher in 2013, well above the national average of 1.3 per cent. The benefits of resource exports, particularly energy, have led to rising incomes in these provinces and higher consumer spending. This spending has also boosted the services sector and real estate activity.
At the other end of the scale, B.C. and Nova Scotia performed below average on employment growth in 2013. Nova Scotia’s economy has struggled to generate strong growth over the past three years, and labour markets have not expanded much. The sluggish recovery in the U.S. economy has hurt Nova Scotia’s economy by limiting export demand. Weakness in the goods-producing industries has constrained overall economic growth despite a better performance by the services sector. 2
There are some notable exceptions to the general trend of the top-performing provinces having resource-dependent economies. Ontario’s employment growth of close to 1.5 per cent in 2013 was, in part, a result of the catch-up following the 2.5 per cent decline in employment in 2009 at the peak of the recession—one of the largest declines in the country—but also due to strength in the services sector. Over the near term, the largest employment increases in Ontario will be in commercial business services.
For more information on the Ontario outlook, see Provincial Outlook Economic Forecast, produced by The Conference Board of Canada.
Why is B.C.’s grade so much worse than that of the Prairie provinces?
British Columbia’s “D” grade for 2013 stands out from the “A+” grades for Saskatchewan and Alberta. Employment in the province actually dropped by 0.2 per cent in 2013. While B.C. (similar to Saskatchewan and Alberta) is blessed with an abundant supply of natural resources, its resource mix differs from the two Prairie provinces. British Columbia depends more on lumber exports, which have been constrained by the sluggish state of the U.S. housing market over the past few years. Also, residential construction has been hurt by a pullback in activity on the heels of surging growth over the past few years. Last year, housing starts in Vancouver declined by around 10 per cent. Employment growth in B.C. is expected to return to more normal levels in line with greater demand for lumber from the United States.
Why did P.E.I. score such a high ranking?
P.E.I.’s employment gain of 1.8 per cent in 2013 earned the province an “A+” grade and put it in the same category as two of the strongest provinces in the country, Alberta and Saskatchewan. The province benefited from solid growth in the wholesale trade industry while relatively robust population growth over the last few years has boosted demand for healthcare and social assistance services leading to strong job gains in that sector. Investment in wind energy has also helped the province’s job market. It is worth noting that the province’s tiny labour market means that a modest gain in employment in one sector of the economy can have a significant impact on P.E.I.’s overall job growth.
Are job growth and the unemployment rate linked?
There is generally a close link between trends in employment and the unemployment rate, in that rising (declining) employment is associated with a decline (increase) in the unemployment rate. However, because of the methodology used to calculate the unemployment rate, it is possible for the two measures to diverge from time to time. This is the case in P.E.I., where employment growth increased from 1.1 per cent in 2012 to 1.8 per cent in 2013 and, at the same time, the unemployment rate also increased, from 11.3 per cent in 2012 to 11.5 per cent in 2013. An economy with improving job prospects can lead previously discouraged workers to re-enter the labour force in the hope of finding a job. An expanding labour force can put upward pressure on the unemployment rate, even if the economy is generating new jobs.
The impact of a rapidly expanding or contracting labour force is readily apparent from trends in the U.S. unemployment rate over the past two years. While the unemployment rate has dropped sharply since the end of the 2008–2009 recession (from around 10 per cent in 2010 to 7 per cent), some of this drop has been linked to a decrease in the labour force as discouraged workers gave up and stopped looking for work.
Will Saskatchewan and Alberta be able to maintain the momentum?
Over the next year or two, the trends in employment growth that have generally seen the Prairie provinces attain higher growth than most other provinces will continue. Although global commodity prices have been weaker over the past year and Chinese demand has eased somewhat, there is still enough resilience in commodity prices to ensure that Saskatchewan and Alberta will continue to benefit from demand and relatively high prices for their resources. However, it is unlikely that lofty increases in employment in the 3 to 4 per cent range will continue over the next year or so. Ontario and Quebec should see higher employment growth as manufacturers benefit from the weaker loonie and rising demand from the key U.S. market.
It is doubtful that Saskatchewan and Alberta will retain their lofty “A+” grades in the future. Employment prospects in the eurozone will improve over the next few years as the lingering effects from the 2008–09 recession continue to dissipate. These two provinces will still record above-average results, but the divergence between growth in employment in most European countries and provinces in Western Canada will likely narrow.
How do the territories rank on employment growth?
Both Yukon and Nunavut earn “A+” grades on this indicator, with higher employment growth than the top international performer in 2013. Employment growth in Nunavut was 6.9 per cent in 2013, a rebound from almost no growth the year before. While Yukon’s employment growth was a more moderate 2.1 per cent, it was higher than any international peer country. Employment in the Northwest Territories contracted slightly in 2013, landing the territory a “C” grade.
Labour markets in the territories are expected to perform well over the next year or two, thanks to the development of new mines and strong construction activity.
The territories are not included in the overall provincial and international benchmarking calculations because data are not available for many of the indicators included in the six main report card categories. The Conference Board is, however, committed to including the territories in our analysis, and so we produce separate territorial report cards when data are available, such as employment growth.
The Conference Board of Canada produces a biannual Territorial Outlook report that examines the economic and fiscal outlook for each of the territories, including output by industry, labour market conditions, and the demographic make-up of each territory. The Territorial Outlook can be accessed online at our e-Library and for clients subscribing to e-Data.
Research on issues affecting the territories is also produced by the Centre for the North, a Conference Board initiative that began in 2009.
What could affect future employment growth in Canada?
In addition to the aging population and the need to improve education standards in Canada, serious supply-side factors have the potential to limit production and employment in the natural resource sector, especially over the medium to long term.
The lack of adequate pipeline capacity in North America has lowered Canadian crude oil prices to levels below the benchmark West Texas Intermediate (WTI) price posted in Cushing, Oklahoma. And the political nature of future pipeline projects has made oil sands producers understandably wary of embarking on new projects that span several years of construction and cost billions of dollars. While the Conference Board’s most recent long-term outlook assumes that sufficient pipeline capacity will be built to accommodate the expected large increase in oil sands capacity, there are no guarantees. The construction of the Keystone pipeline, which will transport crude from Alberta to the refineries in the southeast U.S., is out of Canada’s hands as the oil industry in Alberta eagerly awaits President Obama’s decision on this key issue. Similarly, the decision to build a pipeline transporting oil from northern Alberta to Canada’s west coast for shipping to Asia has been caught up in disputes with First Nations land claims and environmental concerns. While no major projects have been cancelled as a result of pipeline constraints, the risks to job growth for Alberta and Saskatchewan are clearly tilted to the downside at this time.
Not only the energy sector must contend with supply-side constraints on future production and employment. The lumber industry in British Columbia does not have enough rail cars devoted to shipping wood products to the U.S. market. Since rail transportation is the main way to get wood products into the U.S., the end result is that some producers have lost sales or even had to slow production and job creation. The industry is also facing a labour crunch that could affect activity. Many of the workers who were laid off during the extended period of industry weakness that coincided with the U.S. housing meltdown have since found work elsewhere.
Canada’s mining industry also faces supply-side constraints on production and employment. While Canada has some of the most attractive places in the world for mineral exploration and mining investment, there are challenges for those wanting to develop mines. Environmental assessment processes are time-consuming and detailed. Much of Canada’s untapped resources are in remote areas of the North with little or no infrastructure or labour. And more cost-effective mines in other parts of the world will continue to challenge the industry.
Footnotes
1 To compare the performance of Canadian provinces relative to one another, we first determined the average score and standard deviation of the provincial values. The standard deviation is a measure of how much variability there is in a set of numbers. If the numbers are normally distributed (i.e., the distribution is not heavily weighted to one side or another and/or does not have significant outliers), about 68 per cent will fall within one standard deviation above or below the average. Any province scoring one standard deviation above the average is “above average.” Provinces scoring less than the average minus one standard deviation are “below average.” The remaining provinces are “average” performers.
2 The Conference Board of Canada, Provincial Outlook Economic Forecast for Ontario: Autumn 2013 (Ottawa: The Conference Board of Canada, January 2014), 14–15.