
Inward FDI Performance Index
Key Messages
- Ontario is the top-performing province, ranking 4th overall and getting a C grade.
- Manitoba and the resource-dependent provinces of Newfoundland and Labrador, Alberta, and Saskatchewan place near the bottom of the rankings and get Ds.
- Canada gets a C overall and ranks 6th among the 16 peer countries.
- Excluding the exceptional performance of Ireland, which is a bit of an aberration, Canada would get a B, as would Ontario, B.C., and Quebec. All the other provinces would get Cs instead of Ds.
What is FDI?
The International Monetary Fund defines foreign direct investment (FDI) as an investment that allows an investor to have a significant voice in the management of an enterprise operating outside the investor’s own country. The phrase “significant voice” usually means ownership of 10 per cent or more of the ordinary shares or voting power (for an incorporated enterprise) or the equivalent (for an unincorporated enterprise). This may involve either creating an entirely new enterprise or facility or purchasing existing ones. Other types of financial transactions between related enterprises, such as reinvesting the earnings of the FDI enterprise, are also defined as FDI.
How accurate an economic indicator is FDI?
FDI is typically considered to be a significant but lagging indicator of the investment environment. Once a given project or acquisition is decided upon, it can take some time for the funds to be delivered. Therefore, examining data on FDI inflows in a given year generally does not provide the full picture on investor sentiment in that particular year; flows over time should also be considered.
What are the benefits of inward FDI for Canada?
With trade liberalization and the rise of global supply chains, FDI is being used increasingly to restructure business operations, stimulate trade, and enhance profitability, thus expanding national wealth. Traditional international trade theory saw FDI as a substitute for international trade—a way to avoid tariff barriers—such as by setting up branch plants in another market.
The new international trade paradigm—“integrative trade”—recognizes that inward FDI enhances the ability of firms and countries to expand production, resulting in more economic activity, more jobs, new sources of tax revenue, and income gains. While there are concerns about inward FDI—fear of too much political or economic influence by foreign firms and loss of national control over strategic natural resources—the fact is that countries aggressively compete to attract FDI inflows and international business activity.
FDI is a key driver of global economic growth. Over the past four decades, the flow of FDI worldwide has generally outpaced growth in global GDP and in exports, although in the 2010s the three have grown at similar rates.
Countries compete to attract FDI because FDI inflows can help boost productivity. FDI encourages the diffusion of technology management know-how, as well as more efficient resource allocation. Subsidiaries acquire new knowledge and technologies from their international parent. Domestic firms that interact with these subsidiaries also benefit from these transfers of technology and knowledge. Ultimately, FDI leads to higher productivity, improved quality of products, and increased competitiveness. One study showed that Canadian-controlled firms are, on average, 19 per cent less productive than foreign-controlled firms, likely due to inferior technological and operational know-how.1
Inward FDI also increases the pool of investment capital. Rather than replacing domestic investment, FDI supplements capital shortfall and helps to develop home capital markets by creating additional export possibilities.
Finally, inward FDI increases revenues for government both directly, through taxes paid by foreign investors, and indirectly, through additional employment income taxes and sales taxes generated by increased consumer spending.
Why focus on greenfield FDI?
Data on total FDI flows are not available for Canada’s provinces because of the challenges associated with compiling FDI data by province. FDI statistics are enterprise-based and can be difficult to break down by region; for example, given how organizations are structured, investments in a province via a legal entity or holding company may not reflect the final destination of the investment flow. This issue exists at the international level but is further magnified at the provincial level.
While data on total FDI flows are not available for the provinces, comparable data are available on greenfield FDI—investment that expands an existing facility or creates a new facility (as opposed to brownfield FDI, in which a foreign firm purchases an existing facility or company). Because total FDI data are not available at the provincial level, inward greenfield FDI data are used in the analysis. Although the data are not perfect, they do give a sense of which provinces do well when it comes to attracting FDI.2
Given that the same methodology is used to compile both the international and provincial data for greenfield FDI, it is possible to benchmark the provinces’ greenfield FDI in an international context.
At the national level, the same constraints do not apply. There are national data on total FDI flows and stocks that allow for trends to be examined in greater detail than would be possible if greenfield FDI data were used alone. For this reason, sections of the analysis refer to data on total FDI as well (although these data are not used for compiling the rankings for the reasons mentioned above).
What is the inward greenfield FDI performance index?
The inward greenfield FDI performance index captures the relative success of a region in attracting global greenfield FDI. If a region’s share of global inward greenfield FDI matches its relative share in global gross domestic product, the region’s inward greenfield FDI performance index is equal to one. A value greater than one indicates a larger share of greenfield FDI relative to GDP share, meaning that the region attracts more greenfield FDI than its economic size would suggest. A value less than one indicates a smaller share of greenfield FDI relative to GDP share.
In compiling the rankings, each jurisdiction’s inward greenfield FDI index is calculated as an average over the past five years. Although annual data are available, FDI flows are often volatile for smaller jurisdictions, and so a five-year average is used to avoid drawing spurious conclusions based on one year of data.
How do the provinces rank relative to Canada’s international peers?
Only Ireland gets an A grade on this year’s report card. Between 2012 and 2016, the country’s share of global inward greenfield FDI flows was over two times its share of global GDP, with an inward greenfield FDI index of 2.33. Ireland has been an attractive destination for FDI for years thanks to its favourable tax treatment for foreign companies locating in the country. The country’s corporate tax rate of 12.5 per cent remains one of the lowest in the world, and this was a key factor in the country’s real GDP growth averaging close to 6 per cent per year prior to the 2008–09 recession.
Two peer countries, the U.K. (1.71) and Australia (1.26), get Bs. Australia does well thanks to its developing resource base and its proximity to powerhouse Asian economies, like China and India. The U.K. performs well on this measure because it is a financial capital for Europe—although this position may be at risk with its exit from the European Union.
Ontario (1.17) is the top-ranking province, placing 4th overall behind Ireland, the U.K., and Australia, and getting a C grade. B.C.(1.01), and Quebec (0.97) also get Cs and rank among the top third of peer countries.
Overall, Canada ranks 6th among the 16 peer countries and gets a C.
The remaining provinces get Ds. New Brunswick (0.52), Nova Scotia (0.47), and P.E.I. (0.45) have inward greenfield FDI index scores close to or at the peer country median of 0.45.
The bottom-ranking provinces include Newfoundland and Labrador (0.30), Alberta (0.30), and Saskatchewan (0.26). These three provinces ranked first, fourth, and fifth, respectively, among the provinces on the last report card (which examined inward greenfield FDI flows between 2008 and 2012). This dramatic shift in ranking reflects the contraction of investment in the wake of the negative commodity shock in 2014. These provinces are joined at the bottom by Manitoba, which is the poorest-performing province, with an inward greenfield FDI index of 0.25.
Most of the peer countries, and all of the provinces save Ontario and B.C., have inward greenfield FDI index scores of less than one—in other words, they are not attracting a global share of greenfield FDI equal to their global share of GDP.
How would the rankings change without Ireland?
Ireland has been extremely successful at attracting foreign direct investment thanks to low corporate taxes and policies that encourage companies to locate in the country. Its score on the inward greenfield FDI index, 2.33, is more than a third higher than the second-place U.K.’s score of 1.71. Because the letter grades in the report card rankings depend on performance relative to the top and bottom performers, this results in some low grades even for provinces and countries that are attracting their “fair share” of FDI, with indexes above 1.00.
Although Ireland has earned good scores on inward FDI for some time, its most recent performance was a standout even by its own standards. Ireland’s inward greenfield FDI index of 2.33 for 2012–16 is much higher than it was in the previous five-year period, 2007–11, when its score was 1.65. The country’s attractiveness as a destination for investment may have been the driving force behind its astonishing 26 per cent real GDP growth in 2015, which was likely the result of corporate inversions, large returns on foreign assets, and major purchases by holding companies headquartered in the country.
Removing Ireland from the rankings would result in all the provinces and countries jumping up by one letter grade. Canada would become a B performer, as would Ontario, B.C., and Quebec. All the other provinces would get Cs instead of Ds.
How do the provinces fare relative to one another at attracting FDI?
Seeing Ontario, B.C., and Quebec atop the provincial FDI rankings is something of a shift from the last report card, when all of these provinces ranked in the bottom half. Compared with the five-year period examined in the previous report card, 2007–11, Ontario’s inward greenfield FDI index rose from 0.75 to 1.17 for 2012–16, British Columbia’s increased from 0.78 to 1.01, and Quebec’s increased from 0.60 to 0.97. At the same time, the former leaders fell dramatically: Newfoundland and Labrador’s index fell from 4.24 to just 0.30, Prince Edward Island’s fell from 2.11 to 0.45, and Alberta’s fell from 0.80 to 0.30.
Ontario, Quebec, and B.C. have always been in the top five for actual greenfield FDI dollars attracted by provinces, but they traditionally do not fare well on the inward greenfield FDI index because their FDI flows are typically small relative to the size of their economies. These three provinces have not been attracting significantly more greenfield FDI dollars in recent years, but they are attracting the same investment levels even as their share of world GDP is declining, which helps boost their index even with constant FDI inflows.
On the other hand, for the provinces that have tumbled down the rankings, there has been a decline in the dollar value of FDI inflows. In the last five years, Alberta attracted an average of US$1.9 billion of annual greenfield FDI inflows—down from US$2.1 billion in 2007–11. This decline is not surprising given the tumble in oil prices. Similarly, over the last five years Newfoundland and Labrador has attracted an average of $27 million in annual greenfield FDI inflows—down from $152 million in 2007–11.
Why have the former provincial leaders on this measure fallen to the bottom?
It is possible to gain some insights into the provincial rankings by looking at the industry breakdown of the total FDI stock (both greenfield and brownfield) at the national level. FDI can be measured as either a stock or a flow. A flow measures the change in the level of activity that took place during an interval of time, while a stock measures the total level—in this case, of real assets—at one specific point in time. In other words, stock is the accumulation of flows over time.
Despite this year’s report card, the share of total inward FDI in Canada’s manufacturing sector fell from 39 per cent in 1999 to 23 per cent by 2016. This reflects the slower growth of manufacturing activity in developed countries as production has shifted to lower-cost emerging markets. Ontario and Quebec are the manufacturing heartland of the country, so for them to keep increasing their inward FDI indexes would likely require a shift in the share of investment flows back toward the manufacturing sector.
Similarly, although resource-rich provinces do poorly on this year’s rankings, the long-term trends are working in their favour. In 1999, total inward FDI to the mining and oil extraction sector in Canada made up less than 10 per cent of inward FDI stock. This share had increased to 23 per cent by 2016. When commodity prices eventually recover, the resource-rich provinces will likely move back up the rankings, although their FDI indexes may be lower than during the boom years.
Which countries attract the most total FDI?
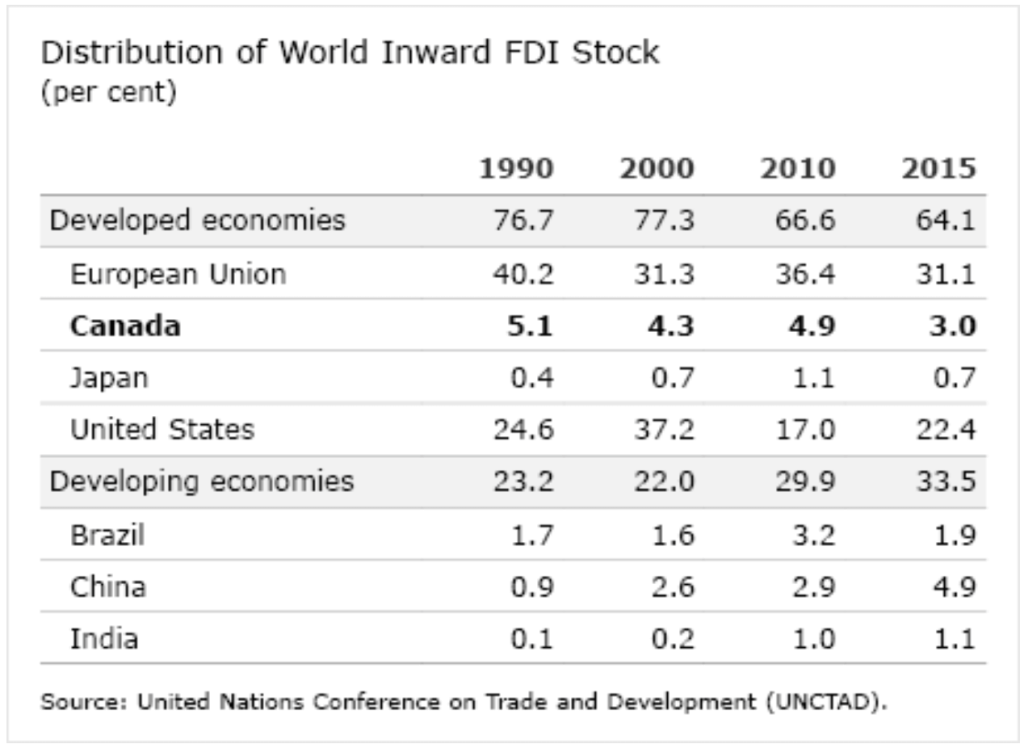
 The U.S. remains the world’s most favoured investment destination by total FDI stocks. Its share of global inward FDI stock fell slightly from 25 per cent in 1990 to 22 per cent in 2015.
China’s share of global FDI stock grew from under 1 per cent in 1990 to 5 per cent in 2015. China’s share of FDI is small compared to the size of its economy because it places many restrictions on foreign direct investment. The OECD publishes an FDI Regulatory Restrictiveness Index that gives countries a rating of between 0 (complete openness to FDI) and 1 (complete closure to FDI). China’s 2016 rating was 0.33—significantly higher than Canada’s rating of 0.17 and the OECD average of 0.07.3
Canada’s share of global FDI fell from 5 per cent in 1990 to 3 per cent in 2015.
Why has Canada become a less attractive destination for FDI in recent decades?
Once one of the world’s largest recipients of total FDI dollars, Canada has become a relatively less attractive destination for total FDI (greenfield investment plus spending on mergers and acquisitions) in recent decades.
Canada has lost some of its luster on all three of the main factors that affect FDI investment decisions:
- access to markets
- access to resources
- opportunities to gain operational efficiencies
Investment to obtain Canadian market access has declined because Canada has a small and shrinking share of the global economy. However, recent governments have pursued free trade agreements with the intent of improving market access for Canada.
Canada receives a higher share of its total FDI in the primary resource sector than do other countries. But while Canada’s natural resources are attractive to foreign investors, they can be more costly to explore and to exploit than elsewhere. For example, the cost of producing a barrel of oil or gas can be more than twice as high as in the Middle East.4 Although these costs may be acceptable when commodity prices are high, they can be a challenge when prices are low, as they have been since 2014.
Multinational enterprises looking for operational efficiencies are dissuaded by Canada’s low productivity relative to its peers. Canada’s low productivity reflects its lower capital intensity and a lack of sufficient investment in research and development (R&D) and other areas that would foster innovation. Canada has neither the low cost of production of developing countries, nor the scale of production of large economies like the United States.
Regulatory barriers to foreign investment is another factor cited as a reason for relatively low inward FDI into Canada. Although some steps are being taken to reduce regulatory barriers to foreign investment, examples in the past—such as BHP Billiton’s aborted effort to purchase PotashCorp and CNOOC’s controversial acquisition of Nexen—may have created an impression of arbitrary policy decision-making on foreign acquisitions in Canada. This may be compounded by the fact that Canadian law gives the federal government considerable discretion to review major foreign acquisitions of Canadian companies and to reject them if they do not provide a “net benefit” to Canada. Reduced regulatory barriers and greater clarity on how decisions are taken would help to build Canada’s attractiveness as an investment destination.
Which countries invest in Canada?
While details on provincial inward total FDI data are not available, we can examine the overall Canadian data to get an idea of which countries have been investing in Canada. In 2016, half of the stock of total inward FDI in Canada came from the United States. This share is down from 70 per cent in 1987 (the earliest date for which Statistics Canada has published data).
Europe’s importance as an FDI source greatly increased over the same period. In 2016, it accounted for 37 per cent of the total FDI stock in Canada, up from 23 per cent in 1987. The two largest European investment sources in 2016 were the Netherlands and Switzerland.
Investments from countries in Asia and Oceania have also increased and now account for 10 per cent of total FDI stock in Canada, up from 6 per cent in 1987.
What are the global trends affecting inward FDI?
Large global FDI flows are a relatively new economic phenomenon. Until the 1970s, countries were reluctant to invest abroad; outward FDI was generally thought to be detrimental to the growth of the home country. Multinational enterprises were viewed as depriving the local capital pool of additional growth and employment by investing abroad. As a result, many countries had foreign exchange controls or limits on outflows of capital.
But in the 1970s and 1980s, countries began opening up to greater foreign trade and investment. With trade liberalization and the rise of global supply chains, FDI became a much sought-after means of generating wealth and stimulating trade—in both directions. The increased acceptance of outward FDI flows created a large pool of investment available for inward FDI.
In the past few years, the value of investments abroad has been challenged in many countries in the developed world. Populist movements resulting from the declining opportunities for the working class have fuelled the backlash against the prevailing consensus on trade and investment.
U.S. President Donald Trump rode a wave of anger and frustration to victory in 2016, promising repeatedly to punish businesses that invest overseas. The Trump administration is still in its early days at the time of writing, but President Trump has already given tax incentives and exerted public pressure on American companies to hire and keep jobs in America rather than investing in new facilities abroad. While the full range of policy actions the administration will take on this front remain unknown, it is likely that they will serve to depress outflows of FDI from America. This could have knock-on effects for inward FDI around the world, as the U.S. is the world’s largest source of outward FDI, representing 23 per cent of total outward FDI stock in 2015.
Footnotes
1 Someshwar Rao and Jianmin Tang, Are Canadian-Controlled Manufacturing Firms Less Productive Than Their Foreign-Controlled Counterparts? Working Paper Number 31 (Ottawa: Industry Canada Research Publications Program, February 2000).
2 The company fDi Markets is the source of the provincial data and of the greenfield data published in UNCTAD’s annual World Investment Report. fDi Markets does not track the equity participation by investors. This means the data may include investments that are not qualified as FDI (i.e., the level of foreign ownership is less than 10 per cent).
3 OECD, FDI Regulatory Restrictiveness Index.
4 WSJ News Graphics, “Barrel Breakdown,” The Wall Street Journal, April 15, 2016.