
GDP Growth
Key Messages
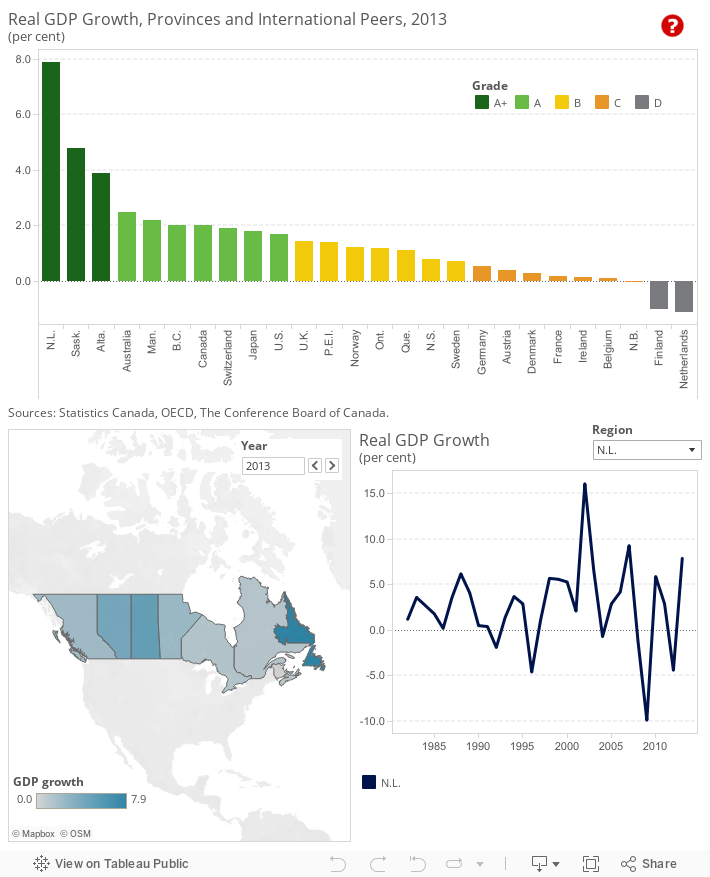
- Newfoundland and Labrador, Saskatchewan, and Alberta all earn ”A+” grades for real GDP growth in 2013, with growth rates higher than that of the top performing peer country, Australia.
- The worst performing province, New Brunswick, earns a “C” grade, with GDP growth similar to the growth rates in recession-wracked eurozone countries.
- Ontario’s grade for GDP growth has steadily slipped over the past few decades.
Putting GDP growth in context
Growth in gross domestic product, or GDP, is often used as an aggregate indicator of the increase in a country’s standard of living or prosperity. The numbers used in this analysis are adjusted to remove the effect of inflation on the level of GDP, producing what economists call “real” economic growth.
How do provincial GDP growth rates compare internationally?
Canada’s provinces have abundant supplies of energy and other natural resources, helping some to attain high grades for real GDP growth compared with our peer countries. In fact, Newfoundland and Labrador, Alberta, and Saskatchewan earn “A+” grades, with GDP growth rates higher than the top performing peer country, Australia, which continues to benefit from close linkages to the economies in the Asia-Pacific region. Manitoba and British Columbia also do well, scoring “A” grades, with higher GDP growth than all peer countries with the exception of Australia.
As the worst-performing province, New Brunswick earns a “C” grade for real GDP growth and ranks among the weak-performing eurozone countries that were mired in a recession in 2013 due to the austerity measures implemented to bring public debt levels under control. France and Ireland also earn “C” grades, and even the powerful German economy receives a “C” grade on GDP growth. While the German economy is in much better shape than most of its neighbours in the eurozone, its exports to other countries in the region have been negatively affected by the recession in key eurozone members such as France. This factor dragged down growth in German real GDP in 2013.
How do the provinces perform relative to each other?
In addition to ranking the provinces against Canada’s international peers, the provinces have been compared with each other and placed into three categories: “above average,” “average,” and “below average.”1 The top three performing provinces—Newfoundland and Labrador, Saskatchewan, and Alberta—are endowed with energy and other resources that have experienced high global demand in recent years. The resulting high prices for many of these commodities have led to solid gains in jobs, income, and spending, which have boosted real GDP growth. The average performance of Ontario and Quebec, Canada’s largest provinces, is due to subdued export demand largely as a results of the sluggish state of the U.S. economy and, to a lesser extent, recessionary conditions in the eurozone. New Brunswick’s below average performance is also attributable to weak export demand from the U.S. in 2013.
Have the provinces’ report cards on GDP growth improved over time?
The grades for many of the provinces have changed over the past few decades, in part due to structural changes in the global and Canadian economies. In the 1980s and 1990s, it was rare for Newfoundland and Labrador to earn a high grade for GDP growth. Since 2002, the province began scoring more “A”s for GDP growth, in line with the development of its offshore energy resources and the rise in oil prices due to high demand from emerging markets such as China. The reliance on energy exports means that GDP growth can be susceptible to volatility in global prices, as is apparent from Newfoundland and Labrador’s performance over time. The province earned “D” grades in 2008 and 2009 as world oil prices plunged due to the severe global recession and another in 2012 thanks to both a drop in metal mining prices and a drop in oil production due to maintenance programs. A reliance on natural resources for wealth can be a mixed blessing; consider the unstable economic performance of resource-rich emerging markets such as Venezuela and Nigeria.2
Saskatchewan and Alberta received a few “D” grades for real GDP growth in the 1980s and 1990s, and even in the early 2000s. However, the surge in commodity prices in the mid-2000s helped boost real GDP growth in these provinces and, since the mid-2000s, “A” and “B” grades have been more common.
The changing fortunes of Ontario, Canada’s largest province, are also apparent from its changing grades for real GDP growth over the past few decades. In the 1980s and 1990s, the province earned mainly “A” and “B” grades. The combination of solid growth in the U.S. economy and a loonie that traded far below par versus the U.S. dollar led to robust growth in exports and manufacturing activity, especially for vehicles and parts. This development resulted in strong growth in jobs and income and, not surprisingly, real GDP growth. However, since the beginning of the 2000s, Ontario has failed to earn an “A” grade and has even recorded a couple of “D”s. In the early 2000s, the loonie started to appreciate from a low of U.S. $0.62 to actually rising above par against the U.S. greenback in 2007. The Canadian dollar was fueled by soaring commodity prices, especially oil. The combination of a rising loonie and a U.S. economy that experienced two tough recessions in the 2000s led to a sharp drop in demand for Ontario’s exports to the United States; the resulting slump in economic activity hurt real GDP growth in the province.
How have the territories fared on GDP growth over the past decade?
In 2013, Nunavut earned an “A+” and the Northwest Territories earned an “A” grade, while Yukon earned a “B.” These above-average grades were due to the strong development in the region’s mining industry. However, the dependence on mining is precarious for two reasons: it is often difficult to obtain financing to develop new mines and prices fluctuate sharply due to the changing conditions in the global economy. This is apparent from the volatility in the grades earned on GDP growth for the territories over the past few decades. Grades of “A” followed by abrupt changes to “D”s are common, and this unpredictability is attributable to the ups and down of economies depending on the mining industry for much of their GDP growth. In this sense, the territories face similar challenges to many emerging markets and other resource-dependent regions, where a heavy reliance on natural resources for wealth and employment creation leaves the economy susceptible to swings in commodity prices.
The Conference Board of Canada produces a biannual Territorial Outlook report that examines the economic and fiscal outlook for each of the territories, including output by industry, labour market conditions, and the demographic make-up of each territory. The Territorial Outlook report can be accessed online at e-Library and for clients subscribing to e-Data.
Research on issues affecting the territories is also produced by the Centre for the North, an initiative of the Conference Board of Canada that began in 2009.
Will Saskatchewan, Alberta, and the other top performers be able to maintain the momentum in GDP growth?
Over the near term, the trends in real GDP growth that have generally seen the Prairie provinces attain higher growth compared with most provinces will continue. While global commodity prices have been weaker over the past year and Chinese demand growth has declined somewhat, there is still enough resilience in commodity prices to ensure that provinces in Western Canada will continue to benefit from strong global demand and relatively high prices for their resources. However, it is unlikely that increases in real GDP growth of a lofty 3 to 5 percent, as recorded at times in Saskatchewan and Alberta, will continue over the near term because we do not expect significant upside in global commodity prices.
Similarly, it is unlikely that Newfoundland and Labrador, the top performer for GDP growth in 2013, will maintain its lead as oil production and construction activity slow down over the near term.
Will Ontario and Quebec continue to be average performers on GDP growth?
Ontario and Quebec should see relatively higher real GDP growth as manufacturers respond to a weaker loonie and rising demand from the key U.S. market. This adjustment will result in higher growth in employment and income as well as economic activity. As the fortunes of Canada’s two largest provinces improve over the near term, while that of resource-dependent provinces wanes somewhat, the divergence in real GDP growth between Central as well as Eastern Canada and the West will likely narrow.
Will the top performing provinces maintain their lead on the international scene?
Newfoundland and Labrador, as well as Saskatchewan and Alberta, had higher GDP growth than all of Canada’s peer countries in 2013. This stellar performance relative to countries in Europe will likely continue over the near term. The recovery from the recession in the eurozone, which has also negatively affected European countries that do not use the euro, such as Switzerland and Norway, will be long and painful, due to the slow pace of reform to labour markets that has transpired in Spain, France, Italy, and Greece, plus the heavy stock of public debt. However, the combination of weaker real GDP growth in Canada’s top-performing resource-dependent provinces and a recovery from the recession engulfing the eurozone will eventually narrow the divergence between Canada’s resource-rich provinces and Europe over the medium to long term.
Australia earned an “A” grade in 2013, with GDP growth very close to the growth rates of some of Canada’s top-performing provinces. Australia is similar to Canada in that part of the economy’s strength is linked to an abundant supply of natural resources. Also, Australia’s close ties with the Asia-Pacific region, which will continue to lead the world economy in real GDP growth over the near to medium term, suggests that the country could be comparable to the Western provinces’ performance on GDP growth.
Footnotes
1 To compare the performance of Canadian provinces relative to one another, we first determined the average score and standard deviation of the provincial values. The standard deviation is a measure of how much variability there is in a set of numbers. If the numbers are normally distributed (i.e., the distribution is not heavily weighted to one side or another and/or does not have significant outliers), about 68 per cent will fall within one standard deviation above or below the average. Any province scoring one standard deviation above the average is “above average.” Provinces scoring less than the average minus one standard deviation are “below average.” The remaining provinces are “average” performers.
2 Despite vast oil wealth, Nigeria’s per capita income is low even compared with other poor countries in Africa while Venezuela has the slowest GDP growth and highest inflation rate in Latin America.