
Self-Reported Health
Key Messages
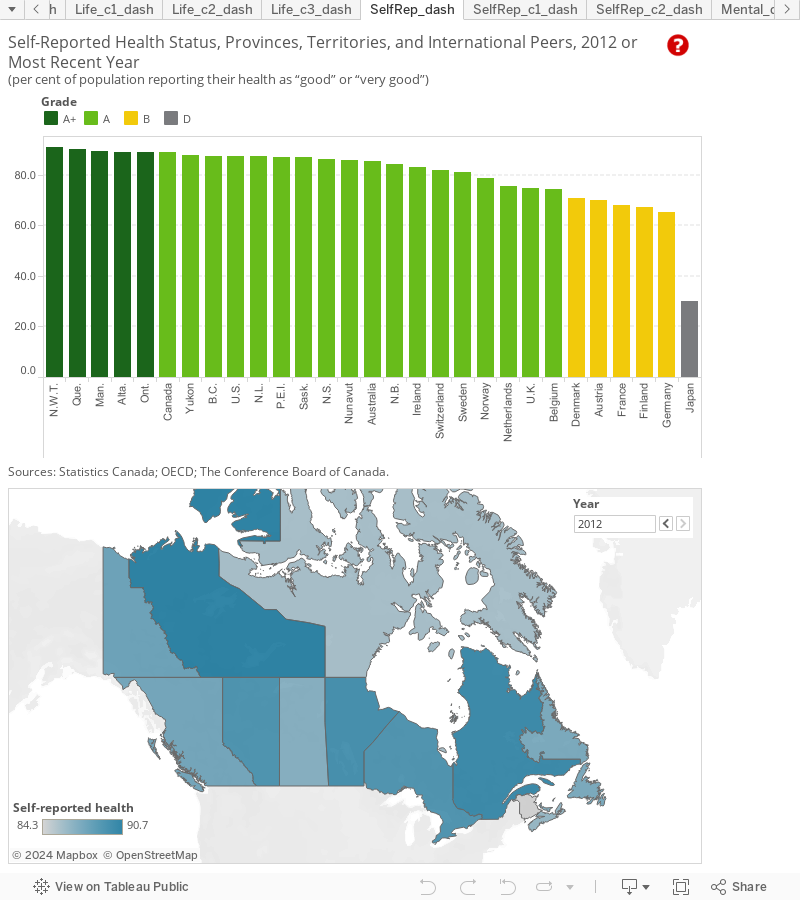
- All provinces and territories score at least an “A” grade, with N.W.T., Quebec, Manitoba, Alberta, and Ontario all earning “A+” grades for self-reported health status greater than any of Canada’s international peers.
- Within Canada, self-reported health is lowest in New Brunswick, although the province still ranks higher than 13 peer countries.
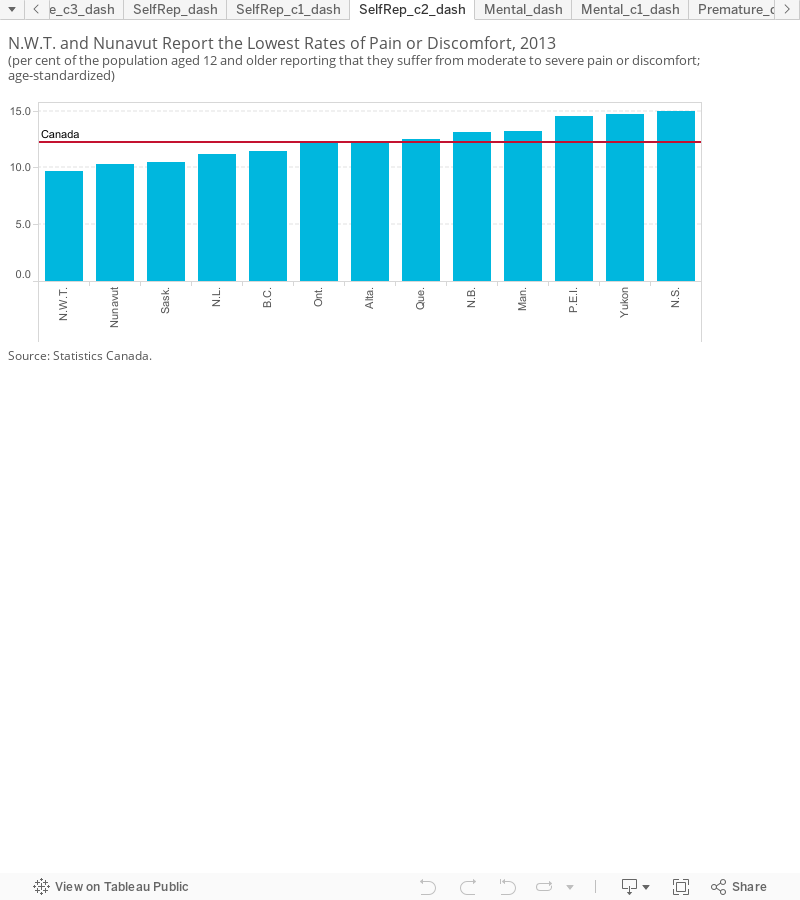
- N.W.T. has the lowest share of the population with self-reported pain or discomfort among the provinces and territories, reinforcing the “A+” it receives on self-reported health status.
Putting self-reported health status in context
“In general, how would you rate your health?” This is one of the most frequently asked questions to assess health status. Self-reported health status is now among the most common measures used in public health surveys in Canada and its peer countries. It represents physical, emotional, and social aspects of health and well-being. How people feel about their own health is seen as a good indication of the burden of disease.
The self-reported health status indicator complements the life expectancy indicator, which is sometimes criticized as placing too much importance on quantity of life and not enough on quality of life.
Is the self-reported health status indicator too subjective?
Some researchers suggest a person’s judgment about his or her health is too subjective. Others note that cultural differences between countries will influence how people evaluate their health. Still, people’s perceptions of their own health have been found to be a good predictor of future health care use and of mortality rates.
Self-reported health status may also reflect aspects of health—such as disease severity and undiagnosed disease—that are not captured in the more objective measures of health status. Good-to-excellent self-reported health status correlates with lower risk of mortality.1 Poor self-reported health status can be a good predictor of subsequent illness and premature death.2
Self-reported health status is also linked to age, with older people more likely than younger people to report poor health.
Are cross-country comparisons of self-reported health accurate?
Self-reported health status reflects people’s overall perception of their health, both physical and psychological. But caution is required when comparing countries. People’s assessment of their own health is subjective, and it can be affected by factors such as cultural background and national traits. More importantly, there are variations in the survey question and answer categories used to measure self-reported health. For instance, in the United States, Canada, and Australia, the response categories offered to survey respondents are different from those offered in the other OECD countries. The response scale in these three countries potentially leads to results that are biased upward.
For example, health surveys normally ask the question as: “How is your health in general?” In the United States, Canada, and Australia, positive responses are divided into three categories: “excellent,” “very good,” or “good.” In the remaining OECD countries, positive responses are divided into two categories: “very good” or “good.” Therefore, the “excellent” and “very good” responses in the United States, Canada, and Australia are typically combined into a larger “very good” category in order to be consistent with responses from other OECD countries. This potentially biases upward the results from the United States, Canada, and Australia by 5 to 8 per cent.3
How do the provinces and territories rank relative to Canada’s international peers?
Of the 16 peer countries, Canada is the top performer on self-reported health status. Each province and territory receives either an “A+” or an “A” grade, and most place ahead of all of Canada’s international peers. N.W.T. leads the way—90.7 per cent of the population reported their health was either “good” or “very good” in 2012.4 Quebec was the only province to reach the 90 per cent threshold. Still, all other provinces and territories have at least 84 per cent of the population reporting that their health was either “good” or “very good.”
For Canada as a whole, about 88.8 per cent of the population reported that their health was either “good” or “very good,” ahead of second-place United States at 87.5 per cent and third-place Australia at 85.4 per cent. Self-reported health tends to be high in most countries. Only, France, Finland, Germany, and Japan have shares of the population reporting good health below 70 per cent.
In fact, Japan is an anomaly on this indicator, as only 30 per cent of the population reported that their health was either “good” or “very good.” It is surprising that Japan scores so low on self-reported health—its citizens have the second-longest life expectancy, a very low premature mortality rate, the third-lowest mortality rate due to cancer, the second-lowest national mortality rates due to diabetes and to heart disease and stroke, and the lowest mortality rate due to nervous system diseases. One reason for Japan’s poor showing on this indicator could be its older, aging population—as noted earlier, older people are more likely to report poorer health.
How do the provinces and territories perform relative to each other?
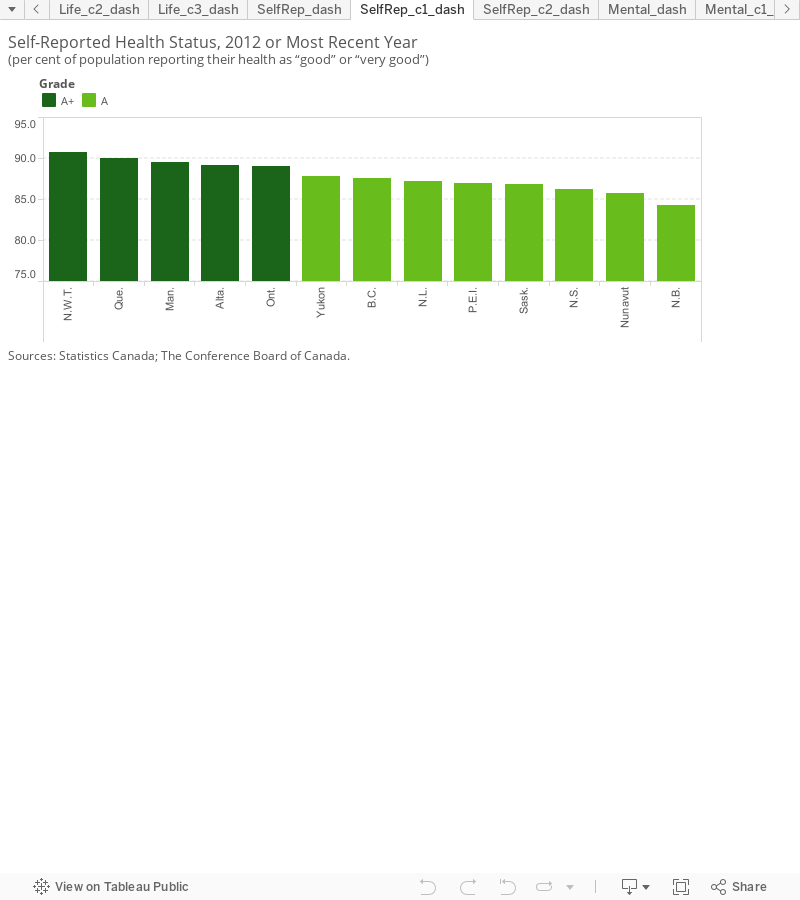
N.W.T. and Quebec are the top-ranked regions in Canada on self-reported health, and the only two with at least 90 per cent of the population 15 years of age and older who reported their health status as “good,” “very good,” or “excellent” in 2012. Most provinces rank high on self-reported health status. Nunavut and New Brunswick are the bottom-ranked within Canada. But with the Canadian average at 88.8 per cent, the discrepancy between the top performer and the bottom performer is minor.
Does pain or discomfort affect self-reported health?
Even when people have been diagnosed with a disease, proper treatment may allow them to live a relatively active and fulfilling life. Despite the illness, it is possible that their self-reported health status is very positive. However, there are instances when, as a result of a disease, people will feel pain or discomfort that can drastically affect their quality of life. In a 1998 study, it was found that pain and discomfort made a significant impact on perceptions of general quality of life related to health. And a longer duration of pain was associated with an increasingly poorer quality of life.5 Therefore, since the health status indicator is self-reported, a prolonged period of pain or discomfort should influence the results.
Across Canada, N.W.T. and Nunavut reported the lowest rates of pain and discomfort in 2013. A mere 9.7 per cent of N.W.T. population 12 years and older reported that they suffered from moderate or severe pain or discomfort, while Nunavut’s figure was 10.3 per cent. At the other end of the spectrum, Nova Scotia, Yukon, and P.E.I. had the highest rates of pain and discomfort—all were close to 15 per cent. Surprisingly, this is not completely consistent with the self-reported health rankings. Nunavut ranks at the bottom on self-reported health status among all the provinces and territories. Nunavut also ranks low on self-reported mental health, so its low ranking on self-reported health may be primarily due to psychological issues rather than pain or discomfort. The poor showing on self-reported mental health is not surprising given Nunavut’s high suicide rate.
In Quebec and Manitoba, a high percentage of the population aged 12 and above reported suffering from moderate or severe pain or discomfort, yet self-reported health in those two provinces ranks high compared with other provinces and territories. On the flip side, a low proportion of Saskatchewan residents report suffering pain or discomfort, but the province ranks low relative to the other provinces on self-reported health.
Newfoundland and Labrador is a puzzling case—the province ranks high on both the self-reported health indicator and on the pain and discomfort indicator yet it has some of the worst health outcomes in the country. Newfoundland and Labrador has the highest mortality rates due to colon cancer, breast cancer, heart disease and stroke, and diabetes among all the provinces.
Footnotes
1 E.L. Idler and Y. Benyamini, “Self-Rated Health and Mortality: A Review of Twenty-Seven Community Studies,” Journal of Health and Social Behavior 38, no. 1 (March 1997), 21–37.
2 J. McCallum et al., “Self-reported Health and Survival: A 7-Year Follow-Up Study of Australian Elderly,” American Journal of Public Health 84, no. 7 (July 1994), 1100–1105.
3 Organisation for Economic Co-operation and Development, Health at a Glance 2013.
4 This is the OECD definition. According to the Statistics Canada data, 90.7 per cent of the population reported that their health status was “excellent,” “very good,” or “good.”
5 Suzanne M. Skevington, “Investigating the Relationship Between Pain and Discomfort and Quality of Life, Using the WHOQOL,” PAIN 76, no. 3 (June 1998) 395–406.