
Mortality Due to Diabetes
Key Messages
- Nunavut is the only Canadian region to place at the top of the rankings—but its low mortality rate due to diabetes is likely a result of high premature mortality from other diseases.
- The prevalence of diabetes continues to increase; about 2 million Canadians suffer from it.
- Preventative measures such as an active lifestyle and healthy eating habits helps reduce the risks of developing type 2 diabetes.
Putting mortality due to diabetes in context
Diabetes is a global epidemic and, according to the International Diabetes Federation, “one of the most challenging health problems in the 21st century.” In 2013, diabetes accounted for about 5.1 million deaths worldwide.1 Globally, it is estimated that more than 382 million people suffer from diabetes; this number is expected to jump to over 592 million by 2035, if nothing is done.2 An estimated 316 million people worldwide have an impaired glucose tolerance—a precursor to diabetes. This number is projected to reach 471 million by 2035, or 8 per cent of the adult population.3
Diabetes has also shifted down a generation—from a disease of the elderly to one that affects those of working age or younger. According to the International Diabetes Federation, as a result of decreasing levels of physical activity and increasing obesity rates, type 2 diabetes in children has the potential to become a global public health issue.4
Diabetes is both a chronic disease and a major risk factor for other chronic diseases. Diabetes has the potential to be a heavy burden on Canada’s health care system, as common complications include heart disease and stroke, vision problems or blindness, kidney failure, and nerve damage.5
Because of these complications, deaths associated with diabetes may often be attributed to other diseases. Therefore, diabetes prevalence rates are considered to be better measures of the burden of this disease than mortality rates. However, because there are no international diabetes prevalence data that are comparable to the national data, we cannot benchmark prevalence rates in the provinces and territories to those of international peers. Instead, we rank mortality rates due to diabetes to gage the relative burden of this disease.
However, mortality rates due to diabetes must be put into perspective. The elderly are more at risk of dying from diabetes than the young, so regions with low life expectancies may not see many deaths, simply because the population does not live long enough. Also, many health complications from diabetes can lead to death from another underlying cause.
How do the provinces and territories rank relative to Canada’s international peers?
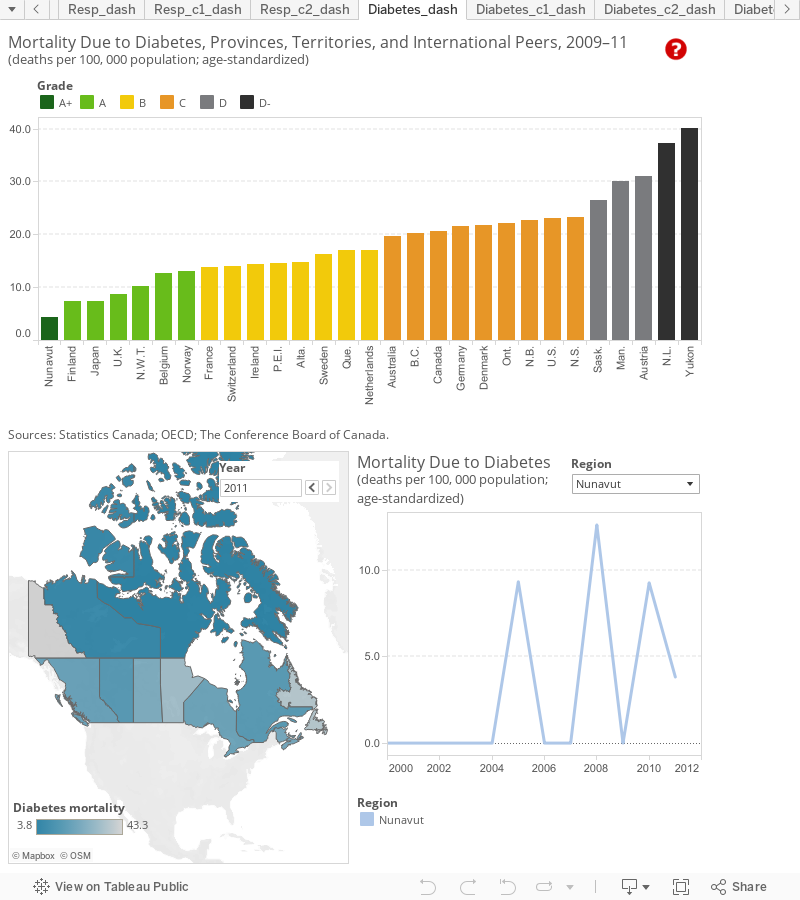
Nunavut and N.W.T. are in the top five among Canada’s top-ranked international peers, Finland, Japan, and the United Kingdom. In fact, Nunavut is the top performer and earns an “A+” grade for having the lowest mortality rate due to diabetes among all the comparator regions. N.W.T. earns an “A” grade and ranks fifth overall. Between 2009 and 2011, the average mortality rates due to diabetes in Nunavut and N.W.T. were 4.4 and 10.2 deaths per 100,000 population, respectively. No province places in the top ten, but P.E.I., Alberta, and Quebec all receive “B” grades.
Overall, Canada scores a “C” grade and ranks 12th among the 16 peer countries (and 18th among all 29 comparator regions). Three provinces and one territory are among the bottom five in the rankings, joined by Austria. Manitoba and Saskatchewan score a “D” grades, while Newfoundland and Labrador and Yukon, the worst-ranked regions in Canada, earn “D-” grades. Yukon has the worst three-year average mortality rate due to diabetes, at 40.2 deaths per 100,000 population.
How do the provinces and territories perform relative to each other?
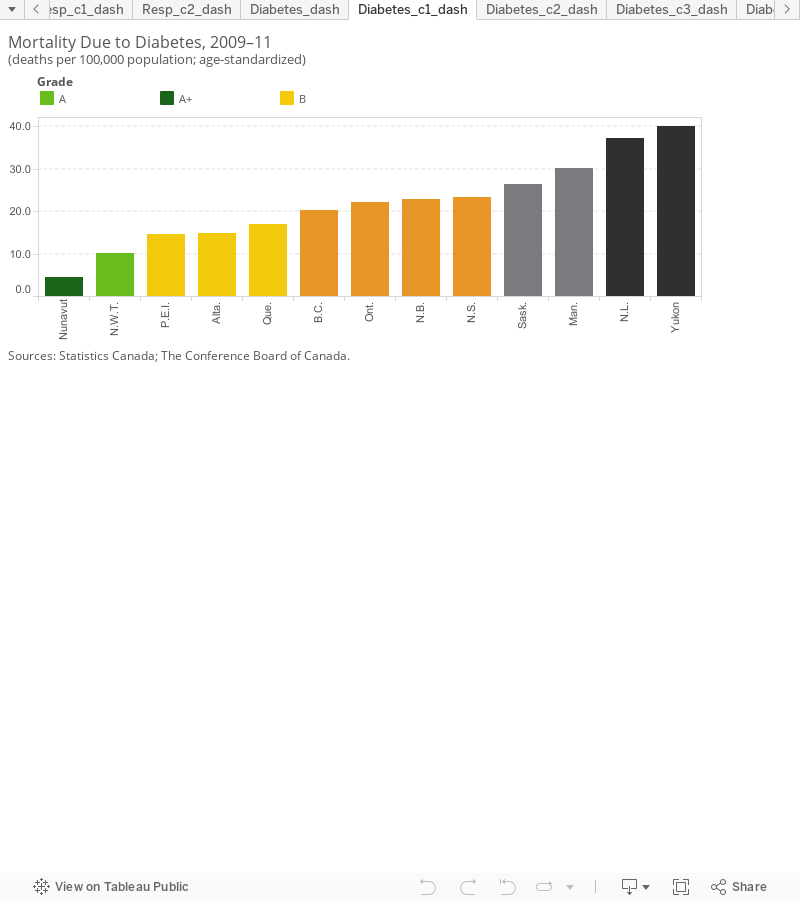
Nunavut and N.W.T. get “A”s for having the lowest mortality rates due to diabetes in the country. P.E.I. and Alberta are the top-ranked provinces, scoring “B”s, along with Quebec. Newfoundland and Labrador, Manitoba, and Saskatchewan are the worst-ranked provinces. But at 40.2 deaths per 100,000 population, Yukon territory has the highest mortality rate in the country.
What about the prevalence of diabetes in Canada?
Diabetes is one of the most common conditions affecting Canadians: an estimated 2 million Canadians, or 1 in 16 people, have been diagnosed with diabetes.6 The number of Canadians actually suffering from diabetes could be much greater given that many living with this chronic condition remain undiagnosed for years.
Also distressing is the fact that the prevalence of diabetes continues to increase. In 2003, 4.2 per cent of the Canadian population suffered from diabetes. In 2013, this increased to 5.3 per cent.7 Indeed, every province has seen an increase in prevalence over the past decade—although in the territories, both Yukon and N.W.T. have seen a decline in prevalence. (The historical data is too infrequent for Nunavut to draw a firm conclusion.) The Canadian Diabetes Association expects that 10 per cent of the population will have by diabetes by 2020.8
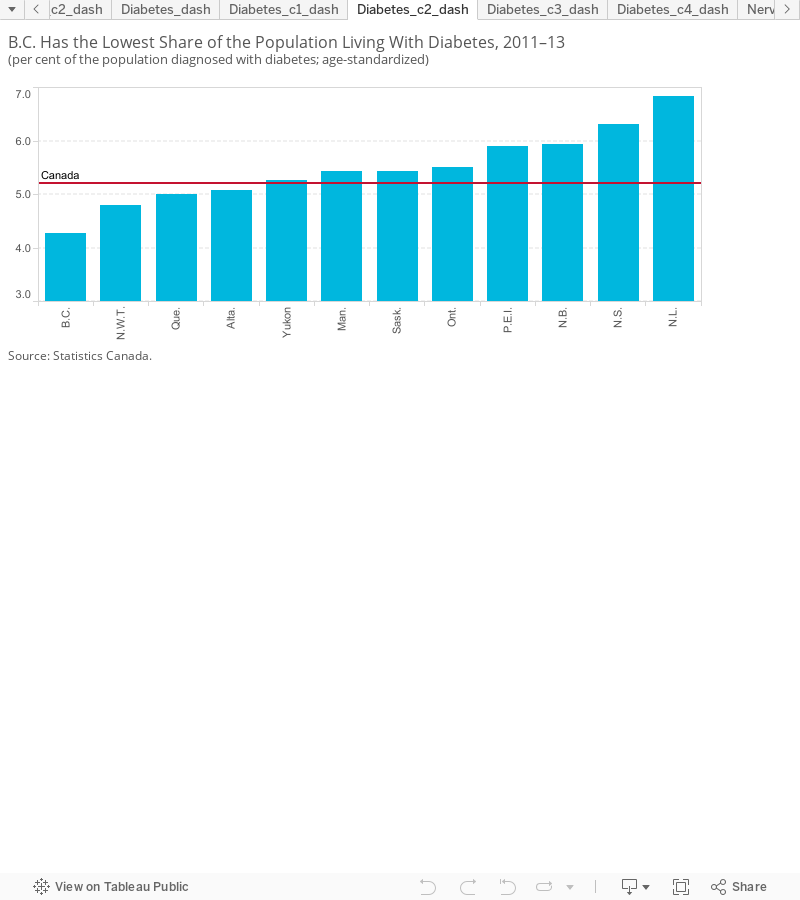
The proportion of the population living with diabetes is lowest in B.C., where only 4.3 per cent of the population had the disease between 2011 and 2013. Yukon, the worst-ranked on mortality due to diabetes, has a three-year average prevalence rate close to the national average. N.W.T. has the second-lowest average prevalence rate at 4.8 per cent. The latest data available for Nunavut are from 2009, when 5.4 per cent of the population had diabetes.9
Newfoundland and Labrador, the province with the highest mortality rate due to diabetes, also has the highest average prevalence rate among the provinces.
What accounts for rising incidences of diabetes and mortality rates?
About 85 to 95 per cent of all diabetes cases in high-income countries are type 2.10 The number of people with type 2 diabetes in Canada is increasing dramatically because of the aging population, rising obesity rates, and increasingly sedentary lifestyles.11 Physical activity, healthy eating, weight loss, not smoking, and stress reduction may help delay or prevent the onset of type 2 diabetes. One study showed that people at risk of type 2 diabetes were able to reduce their risk by 58 per cent by exercising moderately for 30 minutes a day and by losing 5–7 per cent of their body weight.12
No segment of the population is immune from diabetes. Aboriginal people and those of Hispanic, Asian, South or Southeast Asian, or African descent face a higher risk of developing diabetes.13 The fact that people from some of these groups make up the majority of new Canadian immigrants is one reason why diabetes prevalence is expected to grow in Canada.
One of the most disturbing indicators is the growing incidence of type 2 diabetes among children from these high-risk populations. When combined with rising child obesity rates, the warning signs indicate this may be the first generation of children in more than a hundred years who can expect worse health outcomes than their parents.
Are rising rates of obesity behind the increasing prevalence of diabetes?
The increase in type 2 diabetes is due to behavioural and lifestyle choices. Lifestyle choices, such as physical activity and diet, affect health outcomes. Obesity is one of the most significant contributing factors for many chronic conditions, including heart disease, hypertension, and type 2 diabetes.
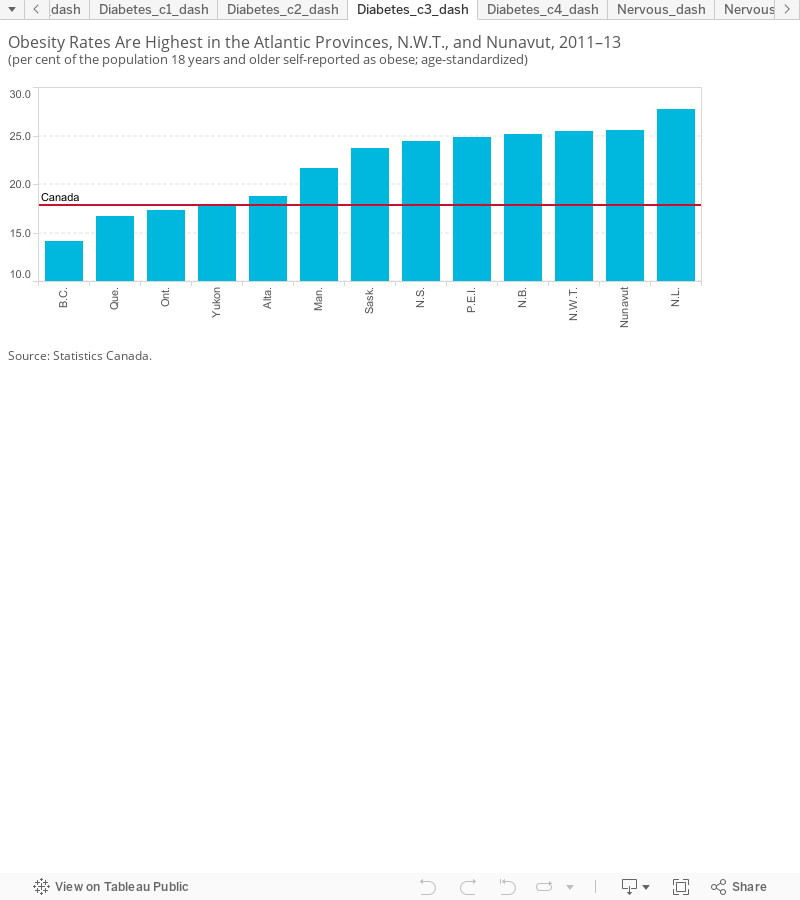
The percentage of Canadians who are overweight or obese continues to increase. About 18.2 per cent of Canadians 18 and over self-reported as being obese in 2013, with a body mass index (BMI) of 30 or more, up from 14.9 per cent in 2003.14 Obesity rates are highest in the Atlantic provinces. About 29.1 per cent of the population over the age of 18 reported themselves to be obese in Newfoundland and Labrador in 2013, and Nova Scotia, P.E.I., and New Brunswick were not that far behind. N.W.T. and Nunavut also have obesity rates over 20 per cent. B.C. has the lowest obesity rate among the provinces, at 14.3 per cent.
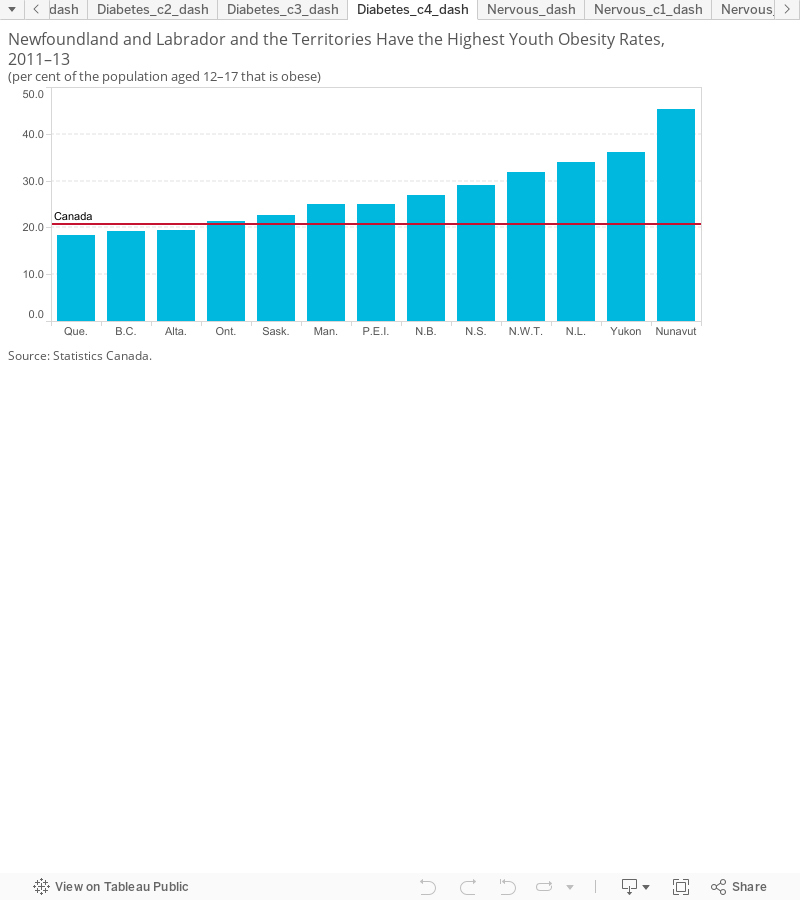
Diabetes can strike at any age. What is discouraging is that 20.7 per cent of Canadian youth aged 12 and 17 self-report as being obese,15 and this rate is going up. Childhood obesity rates are highest in Nunavut and Yukon, as well as Newfoundland and Labrador.
BMI estimates derived from actual measurements of height and weight paint an even bleaker picture.16 According to calculations based on measured data, 25.4 per cent of Canadians aged 15 years and older were considered to be obese in 2011.17 Meanwhile, the measured obesity rate for children was also near 25 per cent.18 The increase in overweight children helps explain the rise in the incidence of children developing diabetes. While diet plays a big role, the likelihood of children being obese also increases if they lead less active lifestyles.
Why do N.W.T. and Nunavut have low mortality rates for diabetes when their risk factors are so high?
People in the territories face the same risk factors for diabetes as those in the provinces—a higher smoking rate and a higher body mass index. So, given that smoking and obesity rates are higher in the territories, one would expect that mortality rates due to diabetes would be higher than or at best on par with the Canadian average. Yet Nunavut and N.W.T. both have low mortality rates due to diabetes and score “A” grades (although Yukon places last among all regions).
Nunavut’s low mortality rate may in part be attributed to the territory’s extensive coverage for diabetes medications under the Non-Insured Health Benefit program.19 However, high mortality due to other diseases (cancer, respiratory diseases) most likely explains why fewer deaths are attributed to diabetes in the N.W.T. and Nunavut. Diabetes may have been a contributing cause to many deaths in these territories, but not recorded as the underlying cause.
Why does B.C. get only a “C”?
B.C. has the lowest diabetes prevalence rate among the provinces—only 4.3 per cent of the population was known to be living with the disease between 2011 and 2013. It also has the lowest obesity rate in Canada and does well on other diabetes risk factors including smoking and physical inactivity. Yet the province earns only a “C” grade on mortality due to diabetes and ranks 4th among the provinces. The reason behind the province’s relatively low ranking on diabetes mortality needs to be further investigated.
What can Canada do to address the dramatic rise in diabetes?
Type 2 diabetes is a complex disease with a high burden of complications. While the number of Canadians diagnosed with diabetes is large, it is estimated that an additional 700,000 people have the disease but don’t know it.20 This has the potential to put enormous strain on the Canadian health care system as those people age.
The Public Health Agency of Canada estimates that the total economic burden of diabetes was $2.3 billion in 2008.21 This includes direct costs related to treatment and care—drug, physician, and hospital spending—and indirect costs—lost productivity associated with illness, injury, and premature mortality.22 This is a conservative estimate given that diabetes is a complex disease linked to the development of other chronic diseases, like cardiovascular diseases.
Indeed, individuals with diabetes have mortality rates at least two times higher than those without—in Canada, people aged 20–39 with diabetes had mortality rates four to almost six times higher in 2008–09. These higher mortality rates result in lower life expectancies. Among the working-age population (aged 20–64 years), those with diabetes had a life expectancy five to ten years lower.23
Although aggressive treatment is required for those with diabetes, there must also be a focus on preventative measures. Maintaining a healthy weight through an active lifestyle and healthy eating habits reduces the risks of developing type 2 diabetes, as well as many other chronic diseases. These healthy behaviours need to be encouraged in the workplace, schools, and the community as a whole. Ultimately, of course, it is up to individuals to take responsibility for their own health and the health of their children. Individuals must be engaged when it comes to treatment—patient engagement in their own care is key to better outcomes.
Footnotes
1 International Diabetes Federation, Diabetes Atlas, Sixth Edition (accessed October 6, 2014).
2 Ibid.
3 Ibid.
4 Ibid.
5 Public Health Agency of Canada, Your Guide to Diabetes, 2009.
6 Statistics Canada, CANSIM table 105-0501, Health Indicator Profile, Annual Estimates, by Age Group and Sex, Canada, Provinces, Territories, Health Regions (accessed October 6, 2014).
7 Ibid.
8 Canadian Diabetes Association, Diabetes: Canada at the Tipping Point, 2011.
9 Statistics Canada, CANSIM table 105-0503, Health Indicator Profile, Age Standardized Rate, Annual Estimates, by Sex, Canada, Provinces and Territories (accessed October 6, 2014).
10 International Diabetes Federation, Diabetes Atlas, Sixth Edition (accessed October 6, 2014).
11 Canadian Diabetes Association, Diabetes: Canada at the Tipping Point, 2011.
12 Canadian Diabetes Association, The Prevalence and Costs of Diabetes, April 2008 (accessed August 18, 2008).
13 Canadian Diabetes Association, Diabetes: Canada at the Tipping Point, 2011.
14 Statistics Canada, CANSIM table 105-0501, Health Indicator Profile, Annual Estimates, by Age Group and Sex, Canada, Provinces, Territories, Health Regions (accessed October 6, 2014).
15 Ibid.
16 Two sets of BMI measurements are available: self-reported and measured. Estimates based on self-reported height and weight are available for most countries. BMI estimates derived from actual measurements of height and weight are sparse and available only for a select number of countries—these data are generally higher and more reliable than BMI estimates based on self-reporting.
17 OECD, Health at a Glance 2013.
18 Ibid.
19 Canadian Diabetes Association, At the Tipping Point: Diabetes in Nunavut, 2011.
20 Canadian Diabetes Association, An Economic Tsunami: The Costs of Diabetes in Canada, 2009.
21 Public Health Agency of Canada, Economic Burden of Illness in Canada 2005–2008, March 2014, 12.
22 Ibid., 3.
23 Public Health Agency of Canada, Diabetes in Canada: Facts and Figures From a Public Health Perspective, 2011, 37–38.