

Innovation Report Card 2021
Updated: June 28, 2021
Innovation is Important.
Innovation is the process through which economic or social value is extracted from knowledge—by creating, diffusing, and transforming ideas—to produce new or improved products, services, and processes.
Innovation is important … at the firm level
Firms and other organizations that innovate successfully enhance their competitiveness and position themselves for growth.
Innovation is important … for communities, regions, and countries
Areas with strong innovation activity see improvements in productivity, economic growth, and job creation. They also have more resources available to spend on education, health, infrastructure, and other priorities.
Key Findings
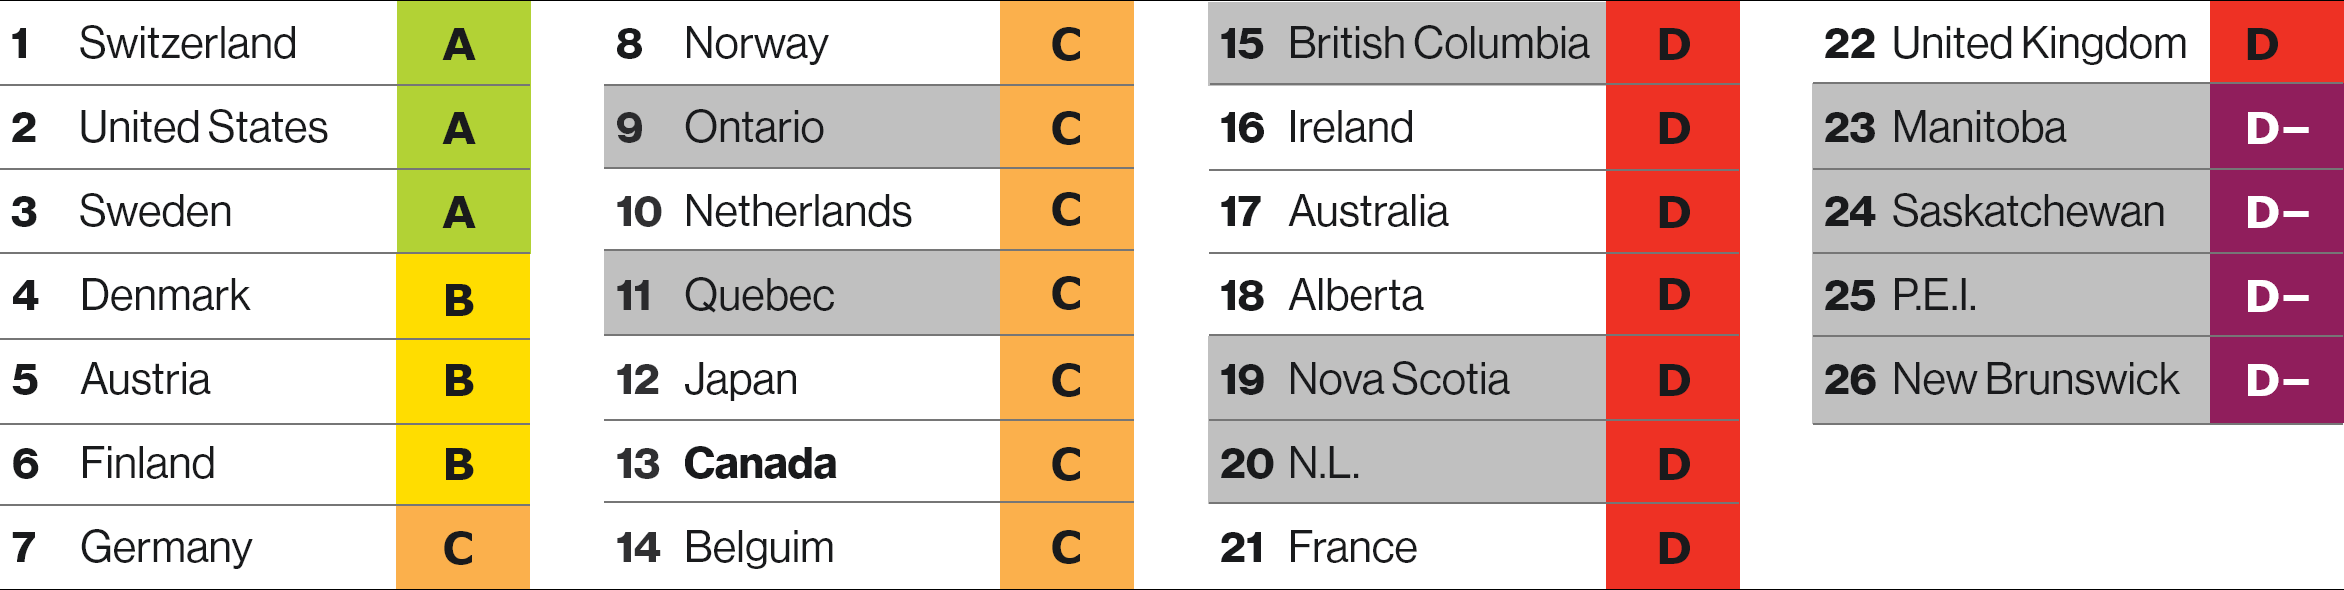
Ontario remains the top-ranked province in the Innovation Report Card; however, it loses its B grade and slides two positions into ninth overall—Quebec also falls two spots into 11th.
New Brunswick, Prince Edward Island, Saskatchewan, and Manitoba remain the lowest-ranked provinces, receiving D– grades.
Nova Scotia and Newfoundland and Labrador reclaim their D grades in this report card.
Canada ranks 11th of 16 peer countries—up two positions—and earns a C on innovation.
Canada Becomes Relatively More Innovative
Source: The Conference Board of Canada.

Canada continues to exhibit relatively weak innovation performance. Volatile resource prices, changing demographics, and increasing economic protectionism are exposing Canada’s business innovation weakness and generating pressure to become more innovative in the coming years.
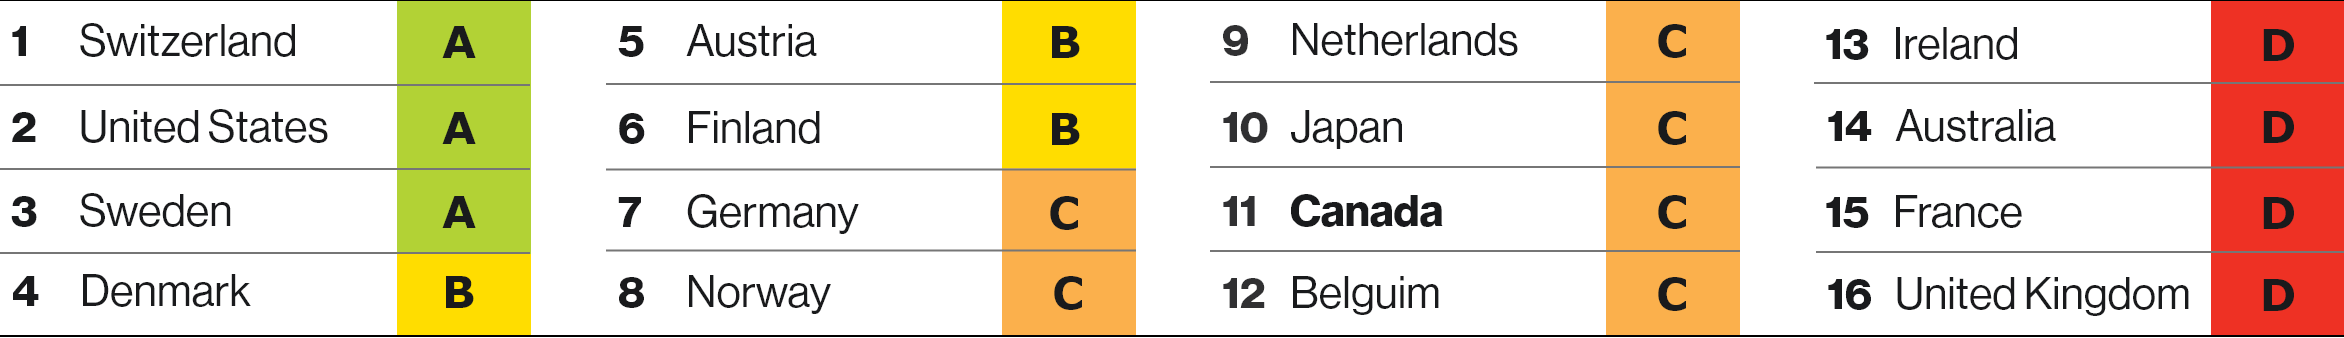
Canada and its Provinces are Below Average
Overall, Canada earns a C on the innovation report card and ranks 10th among 16 peer countries, up from 12th in 2018. While performance on a few indicators has improved, Canada’s ranking change is largely due to underperformance by Japan and Australia.
Provincial Performance Varies
Source: The Conference Board of Canada.

How Does Canada Measure Up?
Pay $1,295 for a detailed analysis of nine innovation indicators.
Reasons for Canada’s Consistent Underperformance

Unfortunately, Canada continues to exhibit relatively weak innovation performance. For the indicators we examined, it is either still too early to tell whether recent provincial and federal government initiatives (e.g., Innovation Superclusters Initiative, Innovative Solutions Canada) are achieving their intended impacts
Until recently, Canadian businesses have had little competition, high resource prices, generally good trade with the United States, and other favourable conditions. This has meant that they haven’t had to innovate as much as businesses in other countries to be profitable.
But a low-innovation, high standard of living equilibrium is unsustainable. Volatile resource prices, changing demographics, and increasing economic protectionism are exposing Canada’s business innovation weakness and generating pressure to become more innovative in the coming years.
In a knowledge-based, globally competitive economy, Canadian businesses will need to make better use of the inputs and improve their ability to innovate to increase their domestic and global market shares.
A Way Forward
Beyond Canada’s relative performance on a selection of high-level indicators, there is much room for improving our understanding of innovation in Canada. In response to this gap, we have developed the Capability-Centred Innovation Framework, which focuses on six categories of organizational capabilities and environmental factors related to firm-level innovation performance. These include:*
- General resources of the firm
- Management capabilities
- Workforce skills and human resource management
- Technological capabilities
- Markets and the environment for business innovation
- The public policy environment for business innovation
The Conference Board of Canada acknowledges the thought leadership, advice, and other important contributions from Alberta Innovates, the National Research Council of Canada Industrial Research Assistance Program, and Canada Economic Development for Quebec Regions to establish this proof-of-concept framework. In addition, these organizations were the first to apply and pilot this framework to their portfolios of clients. These efforts pave the way for a more nuanced understanding of how to strengthen Canada’s innovation performance.
Using data from a survey of Canadian organizations across Canada, we proxy firm-level innovation performance according to revenue and employee growth and have identified several capabilities important to innovation. For example, ensuring diversity within the management team, formally assessing management capabilities and expertise, and participating in daily R&D activities are all important factors that should be strengthened in organizations across Canada.
Another important consideration is the enabling role that not-for-profit organizations play. For example, they often administer grants and advisory services to help businesses iterate and validate their ideas. If Canadian governments want to spur businesses into action, they need to understand how to motivate and equip them for innovation success. Spending money on public R&D and fostering a healthy business environment is only beneficial to the extent that firms can use their capacity and resources effectively and efficiently.
*Organisation for Economic Co-operation and Development and Eurostat, Oslo Manual 2018.
Canada and many of the provinces have performed well on public research and development (R&D) in the past; however, spending as a share of GDP has slipped over the past decade. This could have consequences for scientific research and its foundational role in economic and social innovation. It could also affect the country’s ability to educate and train future researchers to contribute to innovation through roles in academia, business, and government. In addition, reduced funding for R&D could hinder Canada’s ability to address the health, social, environmental, and other challenges it faces.
Policy-makers should:
- investigate whether the current mix of tax incentives and direct support stimulates spending and investment
- examine how structural features of national and provincial economies affect spending on business R&D and technology
- explore new ways to improve spending—including looking at practices in top-performing countries
Provincial and federal government investments in artificial intelligence, digital infrastructure, superclusters, and direct funding mechanisms are promising. Still, these must be followed by increased business R&D investments and activity.
Digital technologies provide the necessary infrastructure to exchange ideas and share data within and across organizations. This exchange is crucial to the research, development, and commercialization of innovative goods and services. The adoption of technology also enables process innovations that increase productivity and allow firms to remain competitive.2 These gains are important for small businesses that represent the majority of firms and employment in Canada but face unique barriers to technology adoption.
There are many barriers to digital technology adoption, including costs, integration time, training requirements, a lack of usability and compatibility, regulatory frameworks and trade barriers, a lack of knowledge and trust in digital solutions, and a limited number of employees with the appropriate skills. Governments should address these barriers to support and incent businesses to innovate. For example, government programs designed to increase exposure to emerging technologies and help businesses navigate available technologies could help address these barriers.
Innovation, Science and Economic Development Canada, “Canada’s Digital Charter in Action.”
Canadians exhibit world-leading levels of entrepreneurial ambition. However, what matters for innovation performance is whether entrepreneurs and innovators are willing and able to act on that ambition—that is, to start and grow new ventures. Canadian entrepreneurs need:
- a healthy climate for new ventures, including adequate market demand and access;
- strong and reliable supply chains, transportation, and communications infrastructure;
- favourable tax rates and tax regime clarity;
- appropriate regulation;
- access to capital and expertise;
- an appropriate mix of core capabilities.
Policy-makers have levers to address some, though not all, of these factors.
Employment declines in occupations that involve routine tasks have been under way for decades. However, it is unclear how advances in technologies such as artificial intelligence and robotics will impact each province. As some occupations and industries are more vulnerable to automation than others, and regional economies have different occupational and industry mixes, each province may experience the impact of automation differently.
Placing automation in the context of other ongoing labour market trends highlights additional vulnerabilities that the provinces will likely face as companies and industries adopt new automation-enabling technologies. Knowing the type and amount of employment at risk of automation—and the economic cost associated with potential transitions to less-vulnerable occupations—could help policy-makers better prepare for technological change. It will also help the provinces equip their workforces with the skills and resources necessary for businesses to increase and sustain their innovation activity.
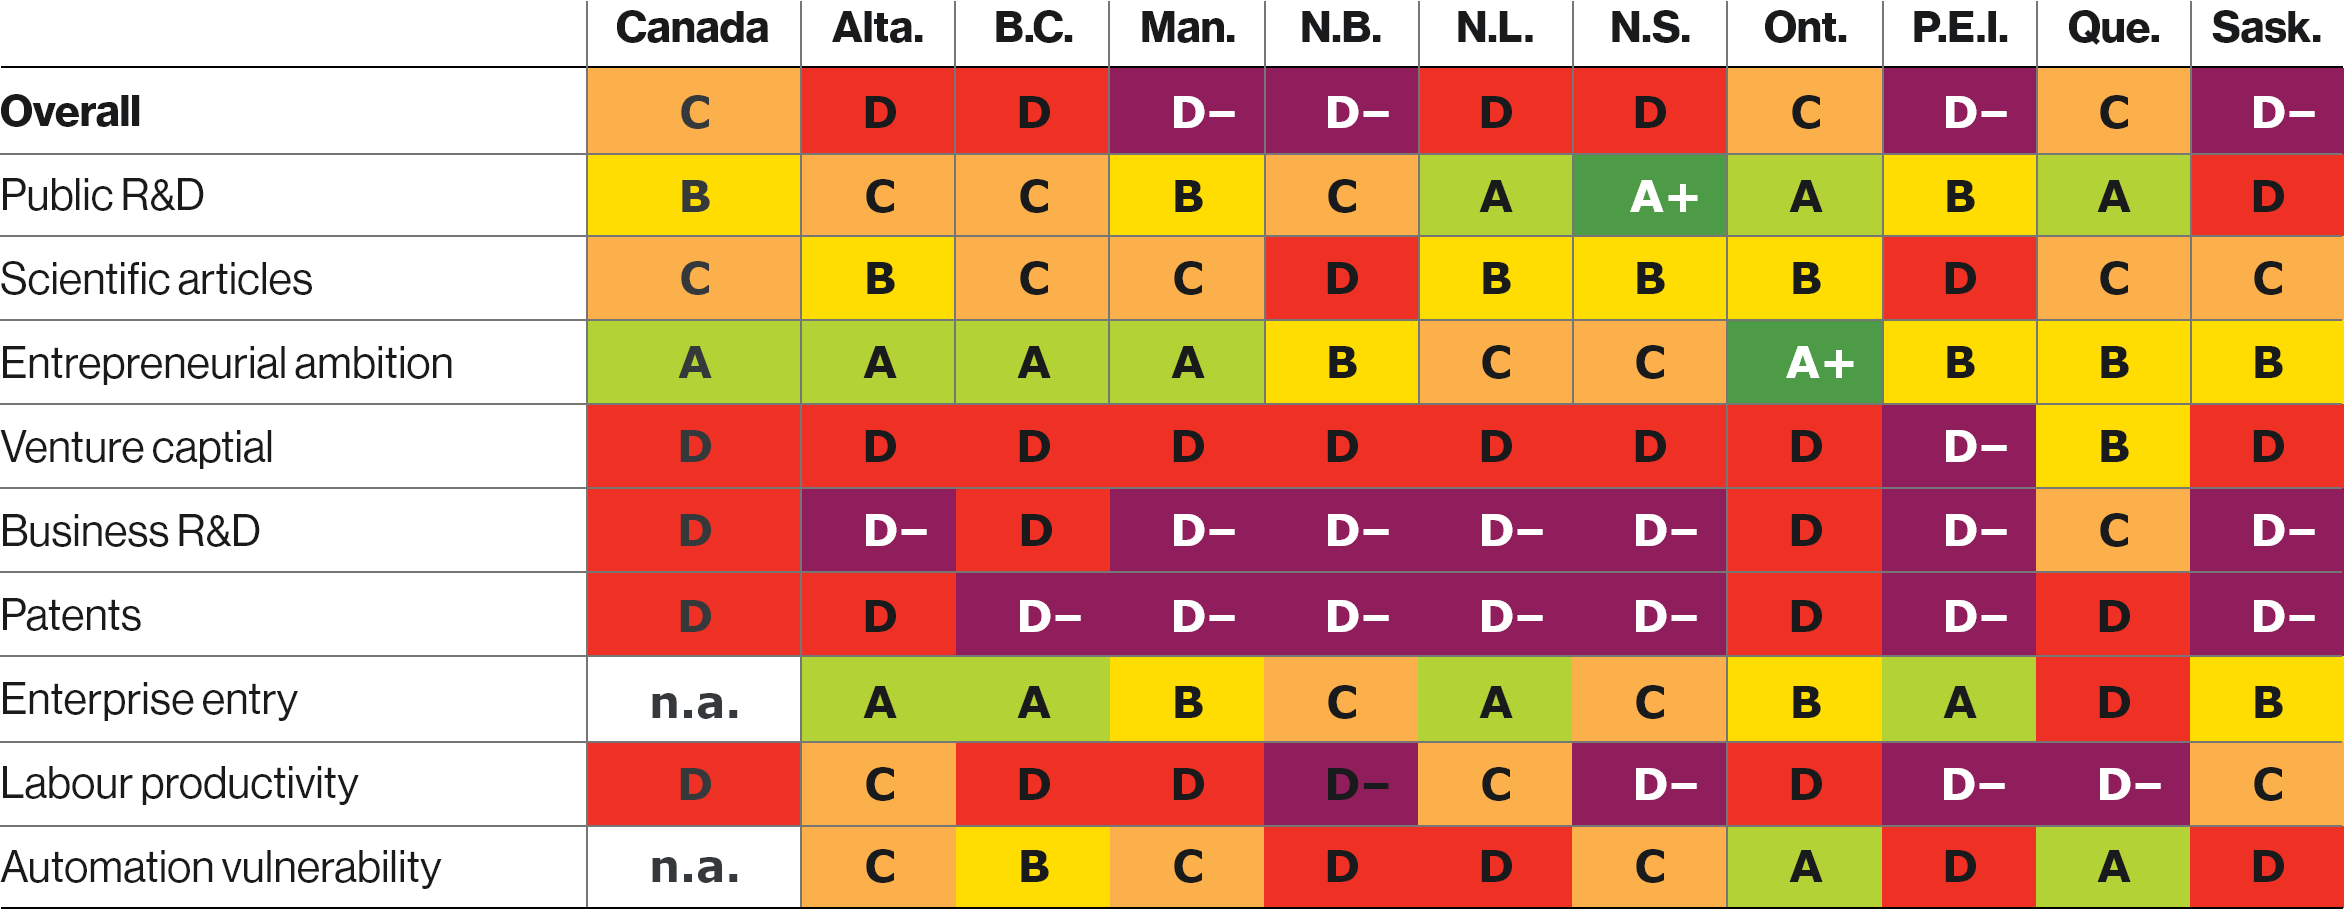
Assessing Canada’s Innovation

Public R&D
Nova Scotia is still the top-ranked province, earning an A+ for outperforming all international peers on public R&D as a percentage of GDP. Eight provinces maintain their grades from the previous report card, while Newfoundland and Labrador climbs from a B to an A and Alberta from a D to a C. Despite improvements in some provinces …
Quebec is the strongest performer of R&D from all sectors, 2017
(spending as a percentage of GDP spending)
Sources: The Conference Board of Canada; Statistics Canada.

Scientific Articles
Nova Scotia leads the provinces on scientific articles per capita, scoring a B grade. Alberta and Newfoundland and Labrador both improve from C to B grades. Prince Edward Island and New Brunswick remain near …
Alberta and Newfoundland and Labrador improve their grades, 2018
(scientific articles per million population)
Sources: The Conference Board of Canada; National Center for Science and Engineering Statstics; Science-Metrix; Statistics Canada.

Automation Vulnerability
Atlantic Canada’s workforce is the most vulnerable to automation due to its demographics and occupational composition, with all but Nova Scotia receiving a D. Western Canada is the second-most vulnerable region due to its current skill levels and higher occupational transition costs. Quebec and Ontario have more …
Atlantic provinces display less workforce resiliency to automation, 2020
(Automation Vulnerability Index)
Source: The Conference Board of Canada.

Entrepreneurial Ambition
Ontario scores an A+ on entrepreneurial ambition, placing first overall; it also improved the most of any province since the previous report card. Canada keeps its A grade and top spot among peer countries from the previous report card. Newfoundland and Labrador is the lowest-ranking …
New Brunswick and Prince Edward Island enter the analysis with B grades, 2019 or most recent year
(percentage of the population aged 18–64 who report being early-stage entrepreneurs; data labels are percentage changes from 2016 or most recent year)
Sources: The Conference Board of Canada; The World Bank; Global Entrepreneurship Monitor.

Venture Capital
Quebec retains its B grade while British Columbia drops to a D. Ontario and Nova Scotia drop to D grades, while Prince Edward Island falls to a D–. Venture capital investment in Canada increased 16–per cent since the previous report card; but …
In relative terms, Quebec’s venture capital investment was twice that of the next province
(venture capital investment as a percentage of GDP; 2017–19 average; data labels are percentage changes from 2014–16 average)
Sources: The Conference Board of Canada; The World Bank; Global Entrepreneurship Monitor.

Business R&D
Seven provinces get D– grades, ranking below all the peer countries on business R&D. Eleven of the 16 international peers now outperform Canada’s top-ranked province, Quebec. Business R&D continues to increase among many international peers, while it continues …
British Columbia and Prince Edward Island are the only provinces to improve since the previous report card, 2017
(spending as a percentage of GDP; data labels are per cent changes from 2014
Sources: The Conference Board of Canada; Organisation for Economic Co-operation and Development; Statistics Canada.

Patents
Seven provinces earn D– grades on patents—up two from the previous report card. Patent production has stagnated in Canada, except in Nova Scotia and Alberta. Alberta is now the top-performing province, but …
Alberta and Nova Scotia are the only provinces to improve since the previous report card, 2017
(PCT patents per million population; data labels are percentage changes from 2013)
Sources: The Conference Board of Canada; Organisation for Economic Co-operation and Development; Canadian Intellectual Property Office; Statistics Canada.

Entreprise Entry
Prince Edward Island is the only province to improve its grade, earning an A with an enterprise entry rate of 17.5 per cent. Nova Scotia and New Brunswick drop grades from C to D, joining Quebec at the bottom. The remaining provinces all drop a grade except …
Prince Edward Island raises the bar for enterprise entry, 2018
(number of new firms as a share of active firms; data labels are percentage changes from 2014)
Sources: The Conference Board of Canada; Statistics Canada.

Labour Productivity
Productivity increased in every province, particularly in Newfoundland and Labrador and Saskatchewan, but the gap between leading international peers remains substantial. Alberta drops a grade from B to C, and Quebec and New Brunswick move from D to D–. Seven provinces earn D– or D grades relative to international peers, indicating …
Labour productivity highest in Alberta, Newfoundland and Labrador, and Saskatchewan, 2019
(GDP per hour worked, US$ 2010 purchasing power parities and prices; data labels are percentage changes from 2015)
Sources: The Conference Board of Canada; Organisation for Economic Co-operation and Development; Statistics Canada.
How Does Canada Measure Up?
Pay $1,295 to access the nine indicators above + appendices.