
Adults With Inadequate Literacy Skills

Stay up to date
Looking for the latest in education and skills planning? Create a CBoC account and sign up for email updates.
Key Messages
- Overall, Canada earns a “C” grade on inadequate literacy skills in the latest international comparison study.
- Forty-eight per cent of Canadian adults have inadequate literacy skills—a significant increase from a decade ago.
- No province earns above a “C” grade for inadequate literacy skills.
Why are literacy skills important?
Literacy skills—along with numeracy skills and problem-solving skills in a technology-rich environment—affect both economic and social well-being.
Given the centrality of written communication and basic mathematics in virtually all areas of life, coupled with the rapid integration of ICT [information and communications technology], individuals must be able to understand, process, and respond to textual and numerical information, print and digital, if they are to participate fully in society—whether as citizens, family members, consumers, or employees.1
The ongoing push to develop literacy skills in children, youth, and adults is indicative of the value of literacy to individuals’ ability to get and keep a job. Inadequate literacy skills hurt individuals’ potential for landing jobs and promotions and hurt the economy through missed opportunities for innovation and productivity. Further, inadequate literacy skills present a risk for health and safety incidents in the workplace: individuals without the requisite reading and comprehension skills may not be able to understand written manuals, warning symbols, and instructions in the workplace.2 There is also a risk that inadequate literacy skills in some workplace settings might endanger public health and safety.
But adequate literacy skills are not only an economic issue; they have profound social consequences as well. For example, individuals with inadequate literacy skills are more likely to report poor health, to be less politically engaged, and to be more socially isolated.3
Beyond the formal school systems, there are other avenues for adults to develop literacy skills. For instance, some provincial governments have offices dedicated to adult skills development, and these often help employers raise literacy skills in the workplace. The federal government’s Office of Literacy and Essential Skills funds research on how best to design and deliver literacy training for adults; it also shares success stories and tools for literacy assessment and training.4
How are literacy skills measured?
For the purposes of the PIAAC, literacy skills are defined as “the ability to understand, evaluate, use, and engage with written texts to participate in society, to achieve one’s goals, and to develop one’s knowledge and potential.”5 This requires “accessing, identifying, and processing information from a variety of texts that relate to a range of settings.”6
In the latest international comparison study, the literacy skills of adults between the ages of 16 and 65 in each participating country were assessed over a continuum of ability using a measurement scale ranging from 0 to 500. The scores were then divided into six proficiency levels: levels 1 through 5 plus below level 1. A person should have at least level 3 literacy skills to function well in Canadian society, according to Employment and Social Development Canada.7 The Conference Board of Canada considers literacy skills below level 3 to be inadequate.
How do Canada and the provinces rank relative to international peers?
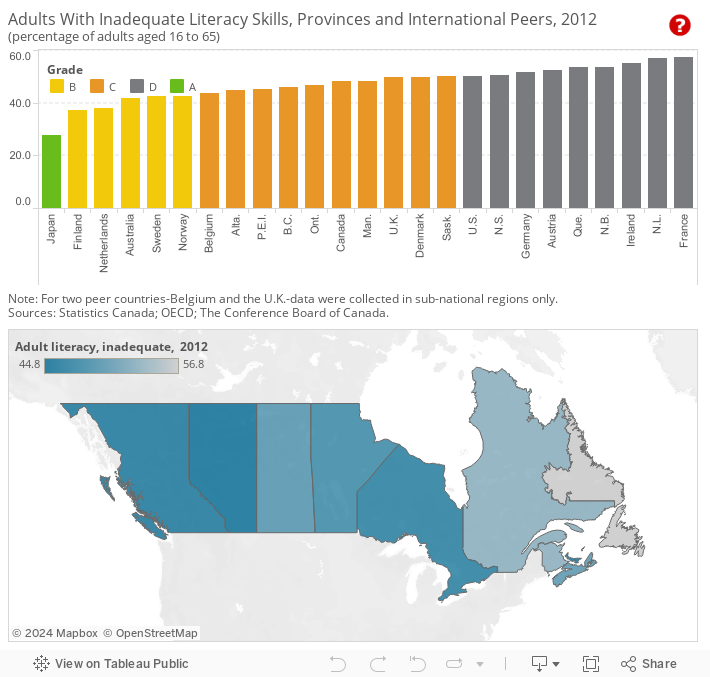
Overall, Canada earns a “C” grade on the share of adults with inadequate literacy skills in the latest international comparison study. Forty-eight per cent of Canadian adults are considered to have inadequate literacy skills. This total includes 31.7 per cent at level 2, 12.6 per cent at level 1, and 3.8 per cent of the adult population scoring below level 1. This implies a sizable share of the adult population—almost a third—are at level 2 and could potentially reach level 3 with limited assistance. Another 16 per cent, who are at level 1 or below, would need significant assistance and training to reach level 3.
Breaking down the study results by province reveals that no province earns above a “C” grade for inadequate literacy skills. Alberta, Prince Edward Island, British Columbia, Ontario, Manitoba, and Saskatchewan each earn a “C” grade. The remaining provinces earn “D”s.
Internationally, only Japan earns an “A” grade, thanks to the relatively low proportion of its adult population that had inadequate levels of literacy. Finland, the Netherlands, Australia, Sweden, Norway, and Flanders (Belgium) each earn a “B” on this indicator—a higher grade than that earned by Canada as a whole and by any individual Canadian province.
How do the provinces perform relative to each other?
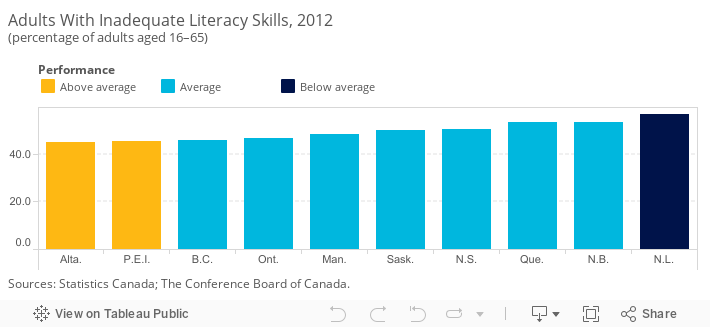
In addition to ranking the provinces against Canada’s international peers, the provinces have been compared with each other and placed into three categories: “above average,” “average,” and “below average.” 8
The results are mixed. Alberta and P.E.I. are above-average performers, while Newfoundland and Labrador, with nearly 60 per cent of adults with inadequate literacy skills, is the sole below-average province.
How do immigrants perform on the literacy test?
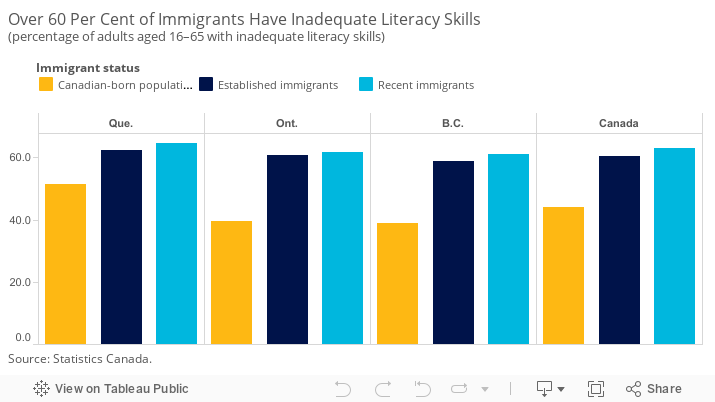
Canada has a diverse population. According to data from the 2011 National Household Survey, 22 per cent of the population aged 16–65 are immigrants.9 Immigrants are not evenly dispersed across the country. Eighty-five per cent of all immigrants to Canada live in three provinces: Ontario (53.3 per cent), British Columbia (17.6 per cent), and Quebec (14.4 per cent). The remaining 15 per cent of immigrants live in the other seven provinces and three territories.10
It is important to assess how immigrants are faring on skills, particularly in those three provinces where immigrants account for a large portion of the working-age population. In general, immigrants, both recent and established, were much more likely than Canadian-born individuals to have inadequate literacy skills. For example, 65 per cent of recent immigrants (those arriving in Canada within the last 10 years) and 63 per cent of established immigrant (those who have lived in Canada for more than 10 years) in Quebec had inadequate literacy skills. This does not mean that these immigrants have poor literacy skills in their native language; however, they are performing poorly in one of Canada’s official languages, either English or French.
How do Aboriginal people fare on the literacy test?
The Aboriginal population in Canada is growing. In 2011, 4.3 per cent of the Canadian population identified as Aboriginal on the National Household Survey, up from 3.3 per cent in 2001.11 About 61 per cent of Aboriginal people identified as First Nations (with about half of those individuals living on reserves), 32 per cent identified as Métis only, and 4.2 per cent identified as Inuit only.12 It is also important to note that almost 15 per cent of Aboriginal people report having an Aboriginal language as their mother tongue, likely affecting their performance on the PIAAC tests, which are administered in only English or French.13 PIAAC oversampled the Aboriginal population to better assess the skills of this diverse population. Only Aboriginal people living off reserve participated in the test.14
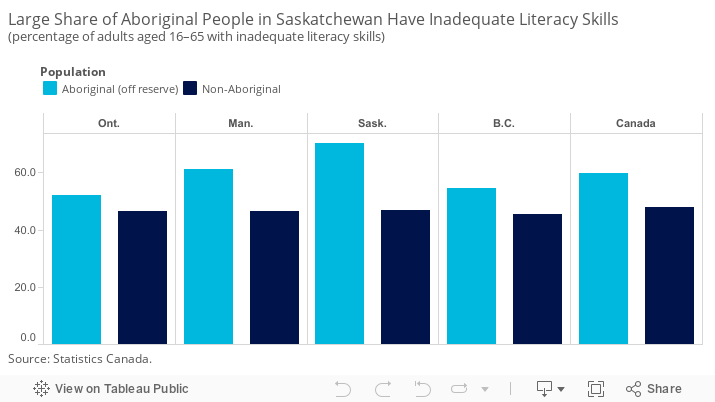
Detailed data are available on the performance of Aboriginal people in Canada as a whole and in four provinces: Ontario, Manitoba, Saskatchewan, and British Columbia. Overall, Aboriginal people are more likely to have inadequate literacy skills than the non-Aboriginal population. However, there is significant provincial variation. Seventy per cent of Aboriginal people in Saskatchewan have inadequate literacy skills—23 percentage points higher than the share of non-Aboriginal people. The gap is lowest in Ontario—52 per cent for Aboriginal people versus 47 per cent for non-Aboriginal people.
While the gap is alarming, it is promising to note that Aboriginal and non-Aboriginal people with similar levels of education have similar literacy skills levels.15 Clearly, improving education outcomes is an important factor in improving the skills of the Aboriginal population. However, much more thorough and sensitive analysis is needed to fully understand both the reasons for the gap and the actions and policies needed to close the gap.
Have high-level literacy rates changed over time?
International comparisons of adult literacy skills have been conducted from time to time over the past two decades. Unfortunately, a direct comparison among the results is not possible for a number of reasons, including the fact that the concept of literacy has changed to reflect the new reality of digital texts.16 However, Statistics Canada re-estimated and re-scaled the data from the 2003 Adult Literacy and Life Skills Survey (ALL) to enable comparison at the national level. Further work is being done to permit more detailed breakdowns by province.17 The re-estimated data reveal that, in 2003, 42 per cent of adults had inadequate literacy skills. That number jumped to 48 per cent in 2012. Despite efforts to improve adult literacy rates in Canada, the share of adults with inadequate literacy skills has increased over the past 10 years.
Footnotes
1 Statistics Canada, Employment and Social Development Canada, and Council of Ministers of Education, Canada, Skills in Canada: First Results From the Programme for the International Assessment of Adult Competencies, Catalogue no. 89-555-X (Ottawa: Statistics Canada, 2013), 5.
2 Alison Campbell, What You Don’t Know Can Hurt You: Literacy’s Impact on Workplace Health and Safety (Ottawa: The Conference Board of Canada, 2010).
3 OECD, OECD Skills Outlook 2013: First Results From the Survey of Adult Skills (Paris: OECD, 2013), 27.
4 Employment and Social Development Canada, Literacy and Essential Skills.
5 OECD, OECD Skills Outlook 2013: First Results From the Survey of Adult Skills (Paris: OECD, 2013), 59.
6 Ibid., 8.
7 Employment and Social Development Canada, Learning—Adult Literacy.
8 To compare the performance of Canadian provinces relative to one another, we first determined the average score and standard deviation of the provincial values. The standard deviation is a measure of how much variability there is in a set of numbers. If the numbers are normally distributed (i.e., the distribution is not heavily weighted to one side or another and/or does not have significant outliers), about 68 per cent will fall within one standard deviation above or below the average. Any province scoring one standard deviation above the average is “above average.” Provinces scoring less than the average minus one standard deviation are “below average.” The remaining provinces are “average” performers.
9 Statistics Canada, Employment and Social Development Canada, and Council of Ministers of Education, Canada, Skills in Canada: First Results From the Programme for the International Assessment of Adult Competencies, Catalogue no. 89-555-X (Ottawa: Statistics Canada, 2013), 46.
10 Statistics Canada, Immigration and Ethnocultural Diversity in Canada, Catalogue no. 99-010-X (Ottawa: Statistics Canada, 2014).
11 Statistics Canada, Aboriginal Peoples in Canada, Catalogue no. 99-011-X (Ottawa: Statistics Canada, 2014).
12 Ibid.
13 Statistics Canada, Aboriginal Peoples and Language, Catalogue no. 99-011-X (Ottawa: Statistics Canada, 2014).
14 Of the 1,400,685 people with an Aboriginal identity in 2011, about 1,086,319 (78 per cent) lived off reserve.
15 Council of Ministers of Education, Canada, “PIAAC in Canada,” Slide Presentation, 2013.
16 Statistics Canada, Employment and Social Development Canada, and Council of Ministers of Education, Canada, Skills in Canada: First Results From the Programme for the International Assessment of Adult Competencies, Catalogue no. 89-555-X (Ottawa: Statistics Canada, 2013), 53.
17 Ibid., 55.