
Adults With Inadequate Problem-Solving Skills
Key Messages
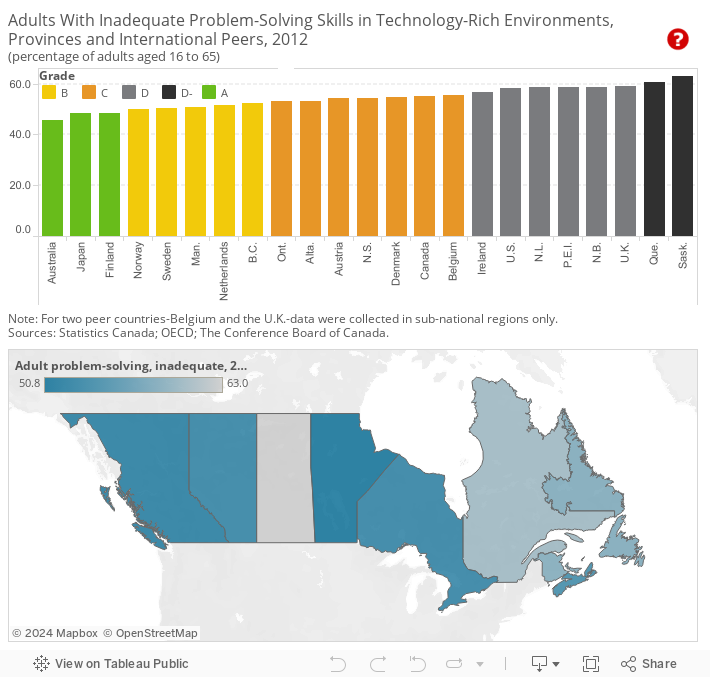
- Overall, Canada earns a “C” grade on inadequate problem-solving skills in technology-rich environments.
- Fifty-five per cent of Canadian adults tested have inadequate problem-solving skills in technology-rich environments.
- No province earned an “A” grade and only two provinces earned a “B” grade.
Why are problem-solving skills important?
Problem-solving skills in technology-rich environments—along with literacy skills and numeracy skills—affect both economic and social well-being.
Given the centrality of written communication and basic mathematics in virtually all areas of life, coupled with the rapid integration of ICT [information and communications technology], individuals must be able to understand, process, and respond to textual and numerical information, print and digital, if they are to participate fully in society—whether as citizens, family members, consumers, or employees.1
Proficiency in literacy, numeracy and problem-solving in technology-rich environments is positively associated with the probability of participating in the labour market and being employed, and with higher wages.2 But adequate literacy, numeracy, and problem-solving skills are not only an economic issue.
They also have profound consequences for such broad domestic considerations as economic disparities between different groups; health outcomes; levels of political engagement; and the degree to which people feel integrated into, or isolated from, society.”3
How are problem-solving skills measured?
For the purposes of PIAAC, problem-solving skills in technology-rich environments are defined as “the ability to use digital technology, communication tools, and networks to acquire and evaluate information, communicate with others, and perform practical tasks.”4
In the latest international comparison study, the problem-solving skills of adults between the ages of 16 and 65 in each participating country were assessed over a continuum of ability using a measurement scale ranging from 0 to 500. The reporting scores were then divided into three proficiency levels. Level 1 is the lowest level, and level 3 is the most advanced level. A prerequisite for being able to assess proficiency in problem-solving was the completion of the computer-based version of PIAAC.
The Conference Board considers adults to have inadequate problem-solving skills in technology-rich environments if they fell into one of three groups:
- They scored below level 2 on the PIACC test on problem-solving in a technology-rich environment.
- They failed the test of their basic computer skills. A prerequisite for being able to assess proficiency in problem-solving skills was the completion of the computer-based version of PIAAC.
- They self-reported that they had no experience with computers.
How do Canada and the provinces rank relative to international peers?
Overall, Canada earns a “C” grade on the share of adults with inadequate problem-solving skills in technology-rich environments in the latest international comparison study. Fifty-five (55.2) per cent of Canadian adults were considered to have inadequate problem-solving skills. This total includes 30.0 per cent at level 1, 14.8 per cent of below level 1, 5.9 per cent who failed the test on basic computer skills, and 4.5 per cent who had no computer experience. This implies a sizable proportion of the adult population are at level 1 and could potentially reach level 2 with limited assistance. The remaining 25 per would need significant assistance and training to reach level 2.
Breaking down the study results by province reveals that no province earns an “A” and only two provinces earn a “B” grade. Three provinces earned “C”s and five earned “D” grades.
Internationally, Australia, Japan, and Finland earn “A” grades on the proportion of the adult population with inadequate problem-solving skills. Three more countries earn “B” grades and the remaining nine countries, including Canada, earn a “C” or “D” grade. No PIACC data are available for France.
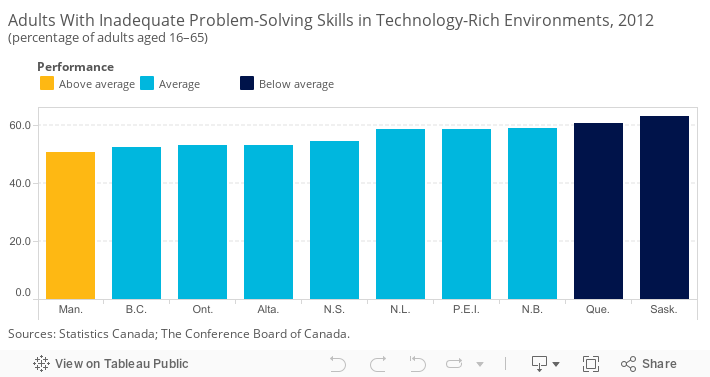
How do the provinces perform relative to each other?
In addition to ranking the provinces against Canada’s international peers, the provinces have been compared with each other and placed into three categories: “above average,” “average,” and “below average.”5
The results are mixed. Manitoba is an above-average performer, while Quebec and Saskatchewan are below average. Over 60 per cent of the adults in these two provinces have inadequate problem-solving skills.
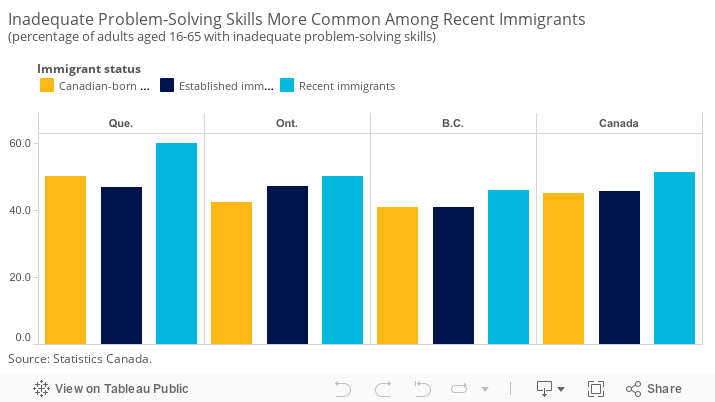
How do immigrants perform on the problem-solving test?
Canada has a diverse population. According to data from the 2011 National Household Survey, 22 per cent of the population aged 16–65 are immigrants.6 Immigrants are not evenly dispersed across the country. Eighty-five per cent of all immigrants to Canada live in three provinces: Ontario (53.3 per cent), British Columbia (17.6 per cent), and Quebec (14.4 per cent). The remaining 15 per cent of immigrants live in the other seven provinces and three territories.7
It is important to assess how immigrants are faring on skills, particularly in those three provinces where immigrants account for a large portion of the working-age population. Compared with the literacy and numeracy results, the gap in shares between immigrant and Canadian-born populations with inadequate problem-solving skills is relatively small. In Quebec, the share of established immigrants (those who have lived in Canada for more than 10 years) with inadequate problem-solving skills is actually lower than the share of the Canadian-born population.
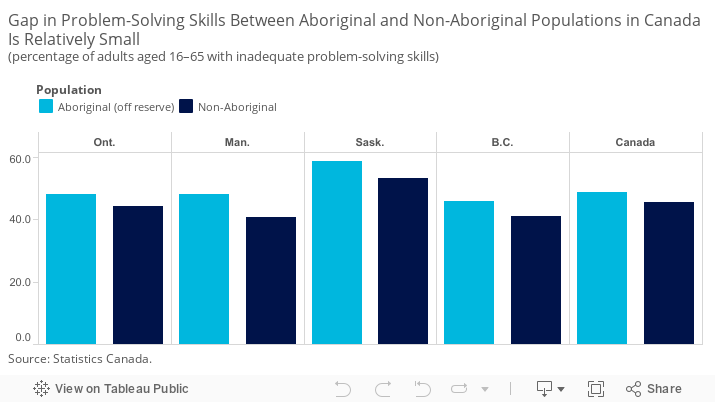
How do Aboriginal people fare on the problem-solving test?
The Aboriginal population in Canada is growing. In 2011, 4.3 per cent of the Canadian population identified as Aboriginal on the National Household Survey, up from 3.3 per cent in 2001.8 About 61 per cent of Aboriginal people identified as First Nations (with about half of those individuals living on reserves), 32 per cent identified as Métis only, and 4.2 per cent identified as Inuit only.9 It is also important to note that almost 15 per cent of Aboriginal people report having an Aboriginal language as their mother tongue, likely affecting their performance on the PIAAC tests, which are administered in only English or French.10 PIAAC oversampled the Aboriginal population to better assess the skills of this diverse population. Only Aboriginal people living off reserve participated in the test.11
Detailed data are available on the performance of Aboriginal people in Canada as a whole and in four provinces: Ontario, Manitoba, Saskatchewan, and British Columbia. Overall, Aboriginal people are more likely to have inadequate problem-solving skills than the non-Aboriginal population. However, compared with the literacy and numeracy results, the gap in shares between the Aboriginal and non-Aboriginal populations with inadequate problem-solving skills is relatively small. Nationally, there is only a 3 percentage point difference in the share of the Aboriginal and non-Aboriginal population with inadequate skills.
Since the PIAAC test was given only to Aboriginal populations living off reserve, it is likely that the results for the problem-solving test would be worse if on-reserve populations had participated in the test. Some reports indicate that only half of First Nations households have access to the Internet and only half of First Nations schools are fully equipped with the necessary technology.12 Lack of connectivity represents a significant barrier for Aboriginal populations.
Footnotes
1 Statistics Canada, Employment and Social Development Canada, and Council of Ministers of Education, Canada, Skills in Canada: First Results From the Programme for the International Assessment of Adult Competencies, Catalogue no. 89-555-X (Ottawa: Statistics Canada, 2013), 5.
2 OECD, OECD Skills Outlook 2013: First Results From the Survey of Adult Skills (Paris: OECD, 2013), 246.
3 Statistics Canada, Employment and Social Development Canada, and Council of Ministers of Education, Canada, Skills in Canada: First Results From the Programme for the International Assessment of Adult Competencies, Catalogue no. 89-555-X (Ottawa: Statistics Canada, 2013), 5.
4 OECD, OECD Skills Outlook 2013: First Results From the Survey of Adult Skills (Paris: OECD, 2013), 59.
5 To compare the performance of Canadian provinces relative to one another, we first determined the average score and standard deviation of the provincial values. The standard deviation is a measure of how much variability there is in a set of numbers. If the numbers are normally distributed (i.e., the distribution is not heavily weighted to one side or another and/or does not have significant outliers), about 68 per cent will fall within one standard deviation above or below the average. Any province scoring one standard deviation above the average is “above average.” Provinces scoring less than the average minus one standard deviation are “below average.” The remaining provinces are “average” performers.
6 Statistics Canada, Employment and Social Development Canada, and Council of Ministers of Education, Canada, Skills in Canada: First Results From the Programme for the International Assessment of Adult Competencies, Catalogue no. 89-555-X (Ottawa: Statistics Canada, 2013), 46.
7 Statistics Canada, Immigration and Ethnocultural Diversity in Canada, Catalogue no. 99-010-X (Ottawa: Statistics Canada, 2014).
8 Statistics Canada, Aboriginal Peoples in Canada, Catalogue no. 99-011-X (Ottawa: Statistics Canada, 2014).
9 Ibid.
10 Statistics Canada, Aboriginal Peoples and Language, Catalogue no. 99-011-X (Ottawa: Statistics Canada, 2014).
11 Of the 1,400,685 people with an Aboriginal identity in 2011, about 1,086,319 (78 per cent) lived off reserve.
12 Chiefs Assembly on Education, A Portrait of First Nations and Education, October 2012.