
Waste Generation

Stay up to date
Looking for the latest in sustainability planning? Create a CBoC account and sign up for email updates.
Key Messages
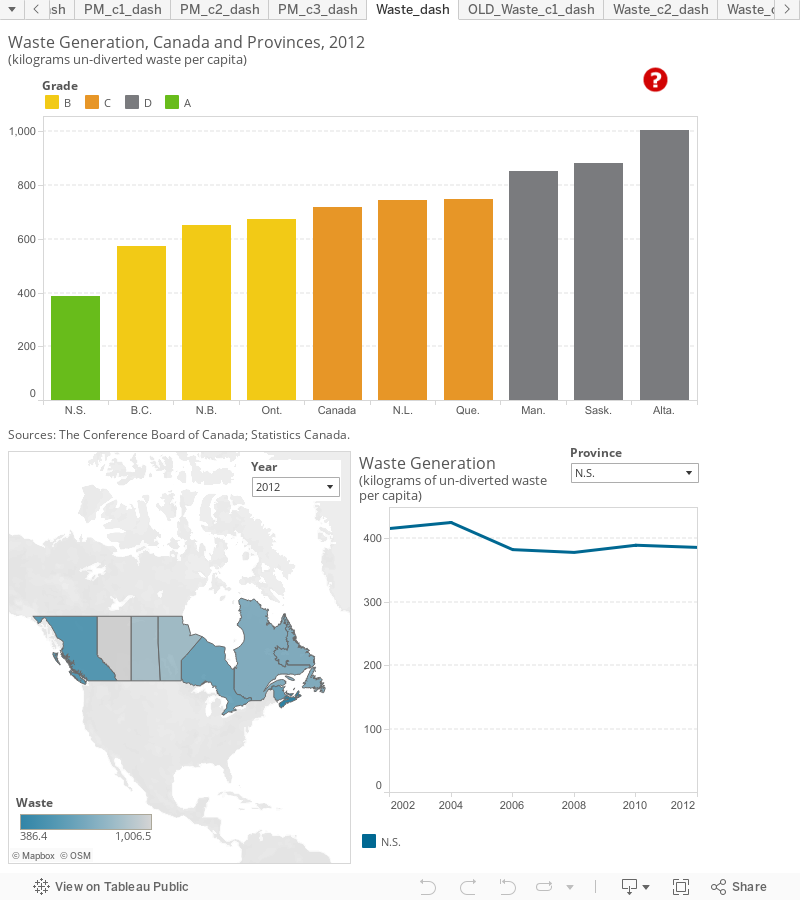
- Nova Scotia earns an “A” grade, with the lowest amount of waste generated per capita among all provinces (386 kg).
- Alberta has the highest rate of waste generation, at 1,007 kg per capita, and earns a “D” grade.
- On average, Canada generates 720 kg of waste per capita.
Putting waste generation in context
Waste that is collected can be treated in two broad ways. It can be disposed, typically by putting it into a landfill or incinerating it, or, it can be diverted from landfills and incinerators, generally through recycling or composting. Disposed waste (referred to hereafter as un-diverted waste) contributes to environmental problems including habitat destruction, surface and groundwater pollution, and other forms of air, soil, and water contamination. Incineration creates toxic substances, while landfills emit methane (which contributes to global warming) and other gases.1
Here, we look at un-diverted solid waste produced by both residential and non-residential sources in Canada and the provinces, measured on a per capita basis. Residential waste includes all non-hazardous waste produced by all residences, which is collected either municipally or brought by individuals to local disposal facilities. Non-residential waste includes non-hazardous waste that is produced by all other sources, including waste generated by industry, commercial activity, and institutions (the IC&I sector) as well as construction. The non-hazardous waste included in the measurements excludes some materials, including: asphalt, concrete, bricks, sand, and gravel. We have not included waste that is diverted from disposal, either through recycling, composting, or other means, as the environmental impacts of diverted waste are much smaller than for disposed waste.
While the OECD reports on municipal waste generation, similar data are not available for Canada. Canadian data are only broken down by residential and non-residential sources. While most residential waste is municipally collected, some but not all non-residential waste is collected privately. Because privately collected waste is not included in the OECD data, the data available for Canada are not comparable to the data presented by OECD. As a result, we have ranked un-diverted waste generation among provinces, but have not made comparisons with international peer countries.
How do the provinces rank relative to each other?
With 386 kg of un-diverted waste generated per capita, Nova Scotia outperforms all other provinces and gets the only “A.” B.C. (573 kg), New Brunswick (651 kg), and Ontario (673 kg) are the second-, third-, and 4th-highest ranked provinces and earn “B” grades. Newfoundland and Labrador (743 kg) and Quebec (749 kg) both earn “C” grades. The remaining three provinces have un-diverted waste generation rates that are well above the Canadian average of 720 kg: Manitoba (854 kg), Saskatchewan (881 kg), and Alberta (1,007 kg) are the worst-ranked provinces and earn “D” grades. Each produces more than two times what the average Nova Scotian produces in a year. No data are available for Prince Edward Island.
How has the performance of Canada and the provinces changed over time?
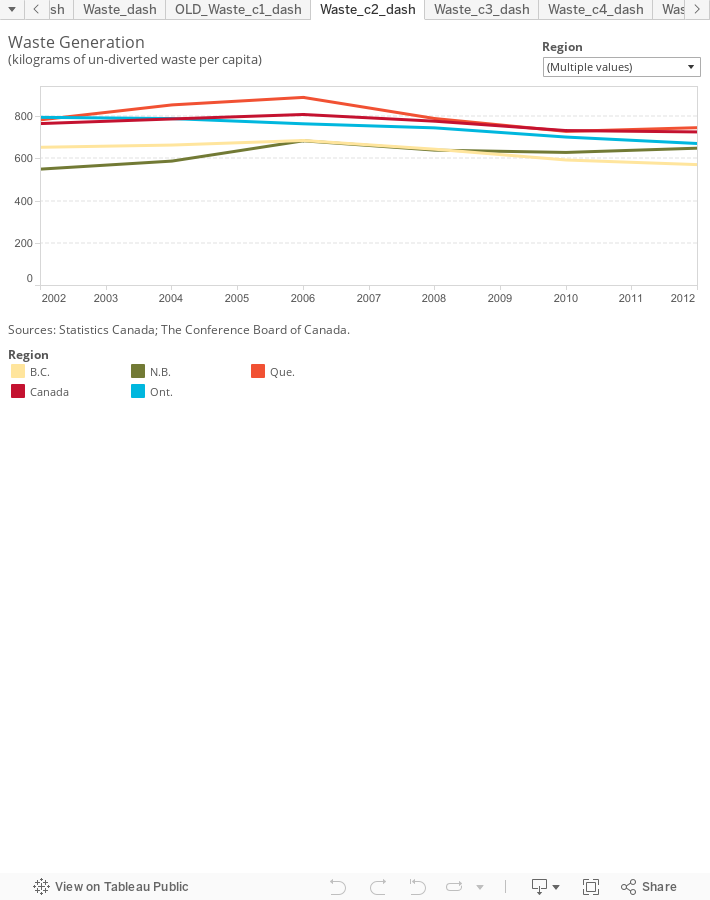
Between 2002 and 2012, Canada’s annual per capita generation of un-diverted waste decreased by 48 kg, or 6 per cent of the 2002 value of 768 kg. This national trend was driven by decreases in several provinces, including Ontario (–124 kg), B.C. (–82 kg), Quebec (–37 kg), and Nova Scotia (–30 kg). The remaining provinces, however, have increased per capita un-diverted waste generation. While Newfoundland and Labrador’s increase was relatively small (+18 kg), other provinces have seen substantive increases: Manitoba (+78 kg), Alberta (+83 kg), Saskatchewan (+83 kg), and New Brunswick (+99 kg).
Canada’s 10-year overall decrease masks that fact that nationally, per capita un-diverted waste generation increased from 2002 to 2006, when it peaked at 811 kg, but has since decreased. This pattern was observed in most provinces, except three that have had increased un-diverted waste generation rates since 2006: Manitoba (+89 kg), Saskatchewan (+41 kg), and Nova Scotia (+3 kg). Therefore, while some provinces have seen a net increase since 2002, most are on a downward trend and have been decreasing their waste production in recent years.
Why do Canadians generate so much waste?
Increases in waste generation are related to rates of urbanization, types and patterns of consumption, household revenue, and lifestyles. Canada’s per capita income and average household disposable income have been steadily increasing since the 1980s, leading to increasing household consumption rates.
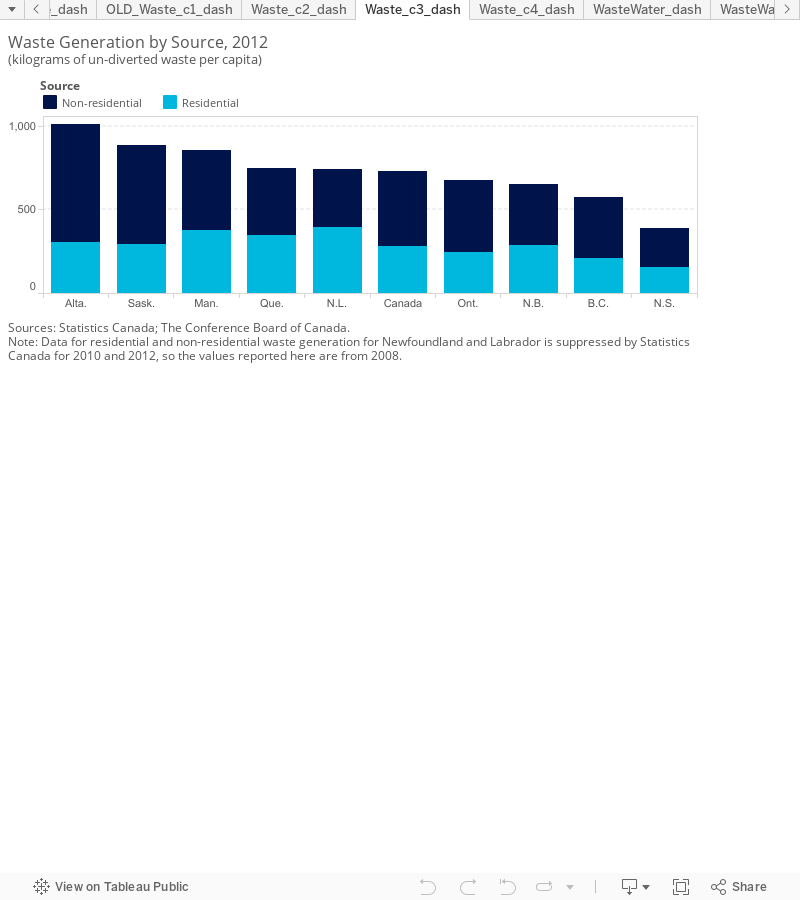
Nationwide, most of Canada’s un-diverted waste (62 per cent) is generated from non-residential sources, such as industry, commercial operations, institutions, and construction. This varies somewhat between provinces. Newfoundland and Labrador deviates the furthest from the national average, with only 47 per cent of its un-diverted waste generated from non-residential sources. At the opposite end of the spectrum is Alberta, where 70 per cent of un-diverted waste is generated from non-residential sources.
The variation in waste generation sources among provinces is likely due to their different economies. However, it doesn’t appear to be strongly correlated with income per capita. Nova Scotia, the province with the lowest per capita generation of un-diverted residential waste (154 kg), has higher disposable income per capita than three provinces that produce more un-diverted waste per capita: New Brunswick, Quebec, and P.E.I.2 At the opposite end of the spectrum, the province with the highest per capita residential un-diverted waste generation, Newfoundland and Labrador (393 kg), had only the fifth-highest disposable income per capita in 2012. The two provinces with the highest disposable incomes per capita, Alberta and Saskatchewan, have un-diverted residential waste production rates (302 kg and 291 kg, respectively) that fall below not only that of Newfoundland and Labrador but also the rates in Manitoba (376 kg) and Quebec (344 kg), provinces with disposable incomes per capita that are below the national average. This suggests factors unrelated to wealth account for the differences in un-diverted residential waste generation.
Do Canada and the provinces manage their waste sustainably?
Including diverted waste, Canada generated 33.4 million tonnes of waste in 2012. Of this, 25 million tonnes were disposed of in landfills or incinerators.3 The remaining 8.4 million tonnes (25 per cent) were diverted from landfills by recycling, reuse, or composting.4 Of the diverted tonnage, 40 per cent was paper and related materials, and 29 per cent was compostable organic materials. The remaining 31 per cent was mainly glass, metals, plastics, household appliances, and materials used in construction.
Nationwide, diversion rates are higher for residential waste than for non-residential waste. Of the 8.4 million tonnes diverted, 4.7 million tonnes originated from residential sources.5 This amounts to one-third of the total 14.3 million tonnes of waste generated by residential sources. Non-residential sources, on the other hand, generated 19.2 million tonnes of waste, but diverted only 3.8 million tonnes, for a diversion rate of only 20 per cent. On a per-tonne basis, the residential diversion rate is over 50 per cent higher than the non-residential diversion rate (33 per cent vs. 20 per cent). It should be noted, however, that when waste is measured using volumes (such as cubic metres instead of tonnes, for example), the diversion rates might be different, because the compositions of residential and non-residential wastes are different.
Across the provinces, diversion rates differ substantially.
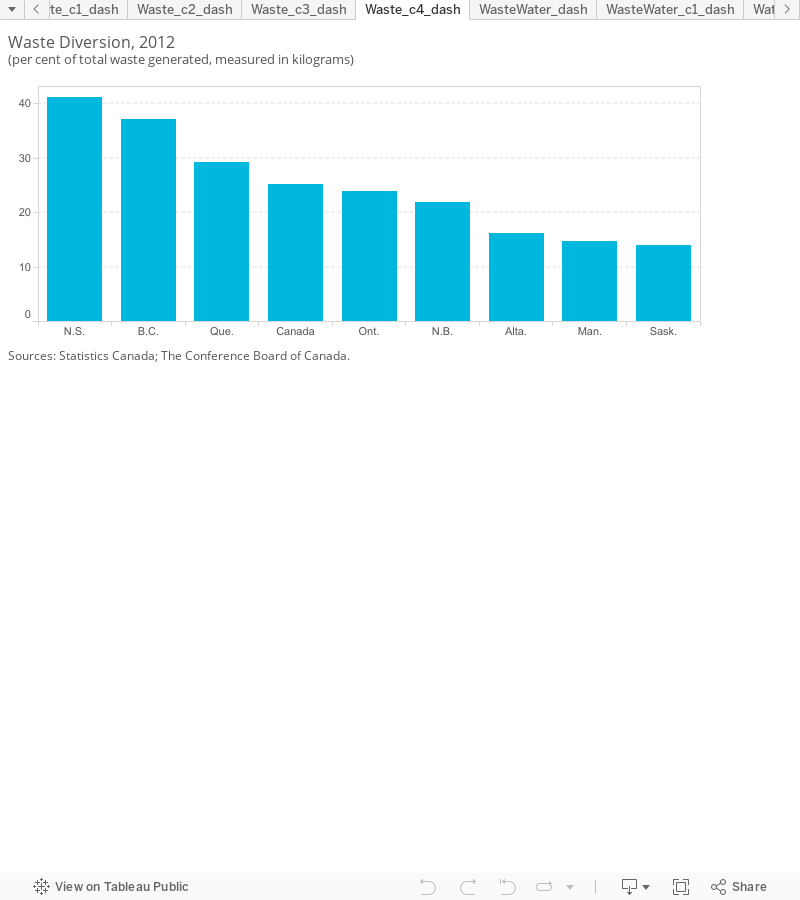
Nova Scotia and B.C. are the standout performers, diverting 41 and 37 per cent (respectively) of their total generated waste from landfills. Quebec, Ontario, and New Brunswick have diversion rates between 20 and 30 per cent, close to the national average of 25 per cent. Alberta, Manitoba, and Saskatchewan have the lowest diversion rates, at around 15 per cent of total waste generated—roughly one-third the diversion rate in Nova Scotia. Nationwide, the waste diversion rate has remained relatively static since 2002, increasing from 22 to 25 per cent by 2012.
Not surprisingly, the provinces that generate the least amount of un-diverted waste per capita (Nova Scotia and B.C.) also have the highest rates of waste diversion. Similarly, the provinces with the highest per capita waste generation (Alberta, Saskatchewan, and Manitoba) have the lowest rates of waste diversion across the provinces. This means that the worst-performing provinces can take two broad approaches to make improvements: reduce the generation of un-diverted waste, and increase the amount and types of waste diverted.
Many municipalities have taken steps to increase waste diversion in recent years. Ottawa, for example, instituted its green bin program in 2010 to collect and compost organic waste. The city then moved garbage pickup to a biweekly schedule in 2012. Collectively, these changes increased Ottawa’s diversion rate of residential waste from 32 per cent to 46 per cent.6 Many other cities have similar green bin programs or other programs to collect residential organic waste, including Vancouver, Toronto, Montréal, Moncton, and Halifax, while other cities, like Calgary, plan to implement their own green bin programs in the near future.
What does Canada need to do to improve its sustainable waste management practices?
Municipal waste management is expensive. Municipal governments in Canada spent more than $3.2 billion on waste collection, transport, disposal, and diversion in 2012.7
Canada needs to further integrate waste management systems (by including waste prevention, recycling, and composting in any disposal systems) while making reduced environmental impact a top priority. To achieve more sustainable municipal waste management practices, the challenge will be to reduce the amount of solid waste generated while increasing the amount of waste diverted from landfills through recycling and other initiatives in an economically feasible way.
For information on how some cities are adopting the concept of industrial ecology to reduce waste, see: “Environmentally Sound Growth” in Chapter 4 of Mission Possible: Successful Canadian Cities.
Footnotes
1 David R. Boyd, Canada vs. the OECD: An Environment Comparison. Victoria: Eco-Research Chair of Environmental Law and Policy, University of Victoria, 2001 (accessed August 19, 2008).
2 Statistics Canada, CANSIM Table 384-5000, Data on Long-Run Provincial and Territorial Economic Performance (accessed November 10, 2015).
3 Statistics Canada, CANSIM Table 153-0041, Disposal of Waste, by Source, Canada, Provinces and Territories (accessed July 9, 2015).
4 Statistics Canada, CANSIM Table 153-0043, Materials Diverted, by Type, Canada, Provinces and Territories (accessed July 9, 2015).
5 Statistics Canada, CANSIM Table 153-0042, Materials Diverted, by Source, Canada, Provinces and Territories (accessed July 9, 2015).
6 City of Ottawa, Garbage and Recycling: Facts and Overview (accessed Nov. 24, 2015).
7 Statistics Canada, CANSIM Table 153-0045, Local Government Characteristics of the Waste Management Industry, Canada, Provinces, and Territories (accessed July 9, 2015).