
Resilient Students
Key Messages
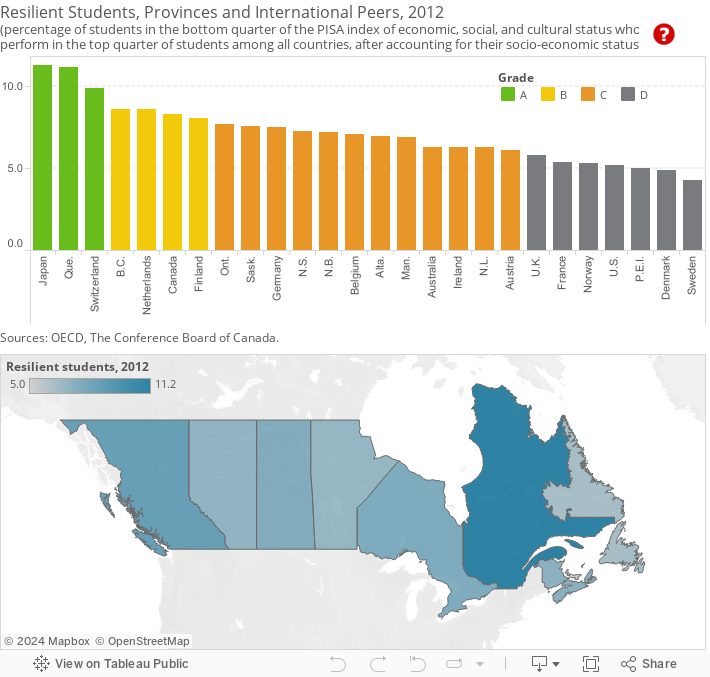
- Quebec ranks below only Japan on the percentage of resilient students, earning the province an “A.”
- P.E.I. has the lowest percentage of resilient students among the provinces and earns a “D” grade.
- The leading countries and provinces on this indicator have taken specific action to help disadvantaged students; in Quebec, interventions begin prior to school to help reduce the academic disparities between socio-economically disadvantaged and advantaged students.
Putting provincial performances on student resiliency in context
There is a well-established correlation between student achievement and socio-economic background. Students from more advantaged backgrounds perform better in school; students from disadvantaged backgrounds perform worse. Students who are able to “beat the odds” and demonstrate high levels of academic achievement despite their difficult socio-economic circumstances are considered “resilient.”1 Understanding what makes a student resilient is important since “education can improve not only an individual’s life chances, but also the conditions of future generations.”2 Resilient students are better positioned to break the cycle of poverty. Through their academic achievements, resilient students can improve their economic and social conditions. Provinces and countries with a higher percentage of resilient students are considered to have more equitable school systems.
How does the OECD define resilient students?
Student performance on the mathematics test from the Programme for International Student Assessment (PISA), an international assessment of the skills and knowledge of 15 year olds coordinated by the OECD, was used to determine resilience. The OECD used the mathematics test to calculate the number of resilient students because mathematics was the area of special focus in the 2012 PISA. (No data were collected in the three territories and in First Nations schools.)
Resilient students are disadvantaged students (i.e., those in the bottom quarter on socio-economic status in a given country or region) who score in the top 25 per cent on the PISA mathematics test across all countries.3 The OECD controls for socio-economic status so it can compare “different education systems based on the performance of students with similar socio-economic status.”4
A student’s socio-economic status is measured by such factors as parents’ education and occupation, the type and number of home possessions (these are considered proxies for wealth), and the availability of educational resources in the home.5 The socio-economic status measure is designed to be internationally comparable.
How does provincial performance on student resilience compare internationally?
Quebec scores just behind the leader Japan, earning an “A.” In Japan, 11.4 per cent of students are considered resilient. Thirty per cent of Japanese students attend schools where more than half of the student body population is socio-economically disadvantaged.6 Importantly, socio-economically disadvantaged schools have better student–teacher ratios than advantaged schools, indicating that Japan is making a concerted effort to boost the performance of students who are at a greater risk of having poor outcomes.7
The rest of the provinces are a mix of “Bs,” “Cs,” and one “D.” Prince Edward Island ranks only ahead of Denmark and last-place Sweden.
Sweden’s results are perhaps surprising. Sweden is known for promoting equality, and so one would expect that disadvantaged students would be given additional supports to help them be resilient. However, the Swedish school system has undergone comprehensive reform that may have inadvertently decreased equality. In the early 1990s, Sweden had a “free choice revolution”; all parents regardless of their financial situation could choose to send their children to a public school or an approved independent school that was now funded by the local municipal government.8 The increased competition among schools was intended to increase quality. Unfortunately, greater choice has led to many of the best students being drawn to the same schools and resulted in greater inequality among schools and poorer outcomes for disadvantaged students.9
How do the provinces perform relative to each other?
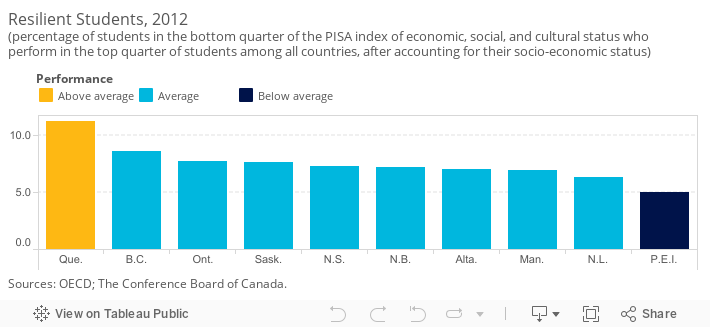
In addition to ranking the provinces against Canada’s international peers, the provinces have been compared with each other and placed into three categories: “above average,” “average,” and “below average.”10
Quebec leads all other provinces, with the highest share of resilient students, and is the only above-average province. Quebec has taken deliberate action to level the playing field between those from distinct socio-economic backgrounds—and the intervention starts early. In 1997, Quebec introduced universal low-cost daycare across the province; a prime objective of the initiative is to “reduce the social disparities observed among children in terms of school readiness.”11 The government also provides additional resources to disadvantaged schools to promote student success and equity. Disadvantaged schools in the province have access to a ministerial database of effective practices for intervention specifically adapted to students from low socio-economic backgrounds.12
Other provinces also have initiatives to improve outcomes for disadvantaged students. For example, Ontario’s Focused Intervention Program provides targeted support for primary schools doing poorly on provincial assessments of reading, writing, and mathematics. Since the program was introduced in 2006, the number of schools with less than one-third of their students performing at provincial standards in Grade 3 was reduced from 19 per cent to 6 per cent.13
P.E.I. has the lowest percentage of resilient students among the provinces, as well as the lowest PISA scores. The low levels across the board likely mean that relatively few students, regardless of socio-economic status, are performing in the top 25th percentile of all PISA test takers. Although politicians argued over the various potential causes of the province’s poor performance when the PISA results were published in late 2013, it remains to be seen what action will be taken by educators and government to remedy the situation.
How can students’ resilience be improved?
The OECD has identified two factors that distinguish resilient students from non-resilient students: attitude and time spent studying.
First, resilient students tend to take a positive approach to learning. Disadvantaged students who are motivated to learn a subject, who are engaged in school, and who have greater confidence in their ability to learn a subject are more likely to do well than disadvantaged students without those attributes.14 Teaching techniques aimed at increasing student interest in a subject and feelings of self-efficacy will increase rates of student resilience.
Second, resilient students spend more time studying. In 2009, PISA focused on science. In almost all participating countries, time spent studying science during school hours was significantly associated with resilience. Particularly for subjects such as science and math, where school is the primary setting for acquiring subject matter skills, class time is critical. Increasing requirements for science and math courses may be one way to help disadvantaged students, because many do not elect to continue in these courses.15
While other factors may also help to increase resilience, the OECD has clearly demonstrated that teachers and school systems play an important part in increasing student resilience.
Footnotes
1 OECD, Against the Odds: Disadvantaged Students Who Succeed in School (Paris: OECD, 2012), 16.
2 Ibid., 14.
3 OECD, PISA 2012 Results: What Students Know and Can Do (Paris: OECD, 2014), 40.
4 Ibid., 40.
5 Ibid., 37.
6 Andreas Schleicher and Miyako Ikeda, Viewing the Japanese School System Through the Prism of PISA (Paris: OECD, 2010), 9.
7 Ibid., 6.
8 Gary Miron, Gary, “In Sweden, Free Choice and Vouchers Transform Schools,” New Options for Public Education, 54, 2 (October 1996): 77–80.
9 The Local, Sweden Tumbles in Global Schools Ranking, December 3, 2013 (accessed March 6, 2014).
10 To compare the performance of Canadian provinces relative to one another, we first determined the average score and standard deviation of the provincial values. The standard deviation is a measure of how much variability there is in a set of numbers. If the numbers are normally distributed (i.e., the distribution is not heavily weighted to one side or another and/or does not have significant outliers), about 68 per cent will fall within one standard deviation above or below the average. Any province scoring one standard deviation above the average is “above average.” Provinces scoring less than the average minus one standard deviation are “below average.” The remaining provinces are “average” performers.
11 Claudine Giguère and Hélène Desrosiers, Child Care From Birth to Eight Years of Age (Québec City: Institute de la Statistique, 2010), 2.
12 OECD, Equity and Quality in Education: Supporting Disadvantaged Students and Schools (Paris: OECD, 2012), 118.
13 Ibid., 26.
14 OECD, Against the Odds: Disadvantaged Students Who Succeed in School (Paris: OECD, 2012), 81.
15 Ibid.