
Racial Wage Gap

Stay up to date
Looking for the latest in economic planning? Create a CBoC account and sign up for email updates.
Key Messages
- In Canada, university-educated Canadian-born members of a visible minority earn, on average, 87.4 cents for every dollar earned by their Caucasian peers.
- The Atlantic provinces have the smallest gaps in earnings between visible minorities and Caucasians, ranging from 7.3 per cent in Nova Scotia to 12.9 per cent in New Brunswick.
- The gap in earnings among Canadian-born individuals of different ethnic ancestry varies—in 2010, individuals of Japanese ancestry earned 3.7 per cent more than their Caucasian peers, whereas individuals of Latin American ancestry earned, on average, 31.7 per cent less than their Caucasian peers.
Putting the racial wage gap in context
Canada is one of the most racially diverse countries in the world. In 2011, it was home to over 6.2 million people who identified themselves as a member of a visible minority group. Of these, 30.9 per cent (over 1.9 million people) were born in Canada.1
In 2011, the three largest visible minority groups in Canada were South Asian, Chinese, and black.
South Asians (individuals who reported East Indian, Pakistani, or Sri Lankan ethnic ancestry) accounted for 25 per cent of the total visible minority population and 4.8 per cent of Canada’s total population.2 Individuals of Chinese ancestry made up over 21 per cent of the total visible minority population and 4 per cent of the total population. Individuals who identified as black (either alone or with other ancestral origins, such as Jamaican, Haitian, Trinidadian/Tobagonian, or Somali) made up over 15 per cent of the total visible minority population and 2.9 per cent of the total population.
Despite a steady increase in the number of individuals of different races in Canada, their effective and full socio-economic integration continues to be a challenge in many regions.
Finding ways to reduce the gap in earnings for visible minorities is important. Not only does this gap contribute to the racialized experience of poverty, but it also creates marginalization, vulnerability, and social alienation in the workforce and for communities of racialized Canadians.3
How is the racial wage gap calculated?
The racial wage gap is the percentage difference in full-year, full-time median wages and salaries between university-educated Canadian-born visible minorities and Caucasians. We compute the wage gap for university-educated individuals to ensure that we are comparing data for those with similar educational attainment levels. Wages and salaries refer to gross wages and salaries before deductions for such items as income tax, pensions, and employment insurance.
Because the data for the racial wage gap are older than the data for other society report card indicators, we did not grade the provinces on this indicator. However, we believe it is important to present data on racial wage gaps in order to compare race-related earning inequities across jurisdictions.
How do the provinces rank relative to each other?
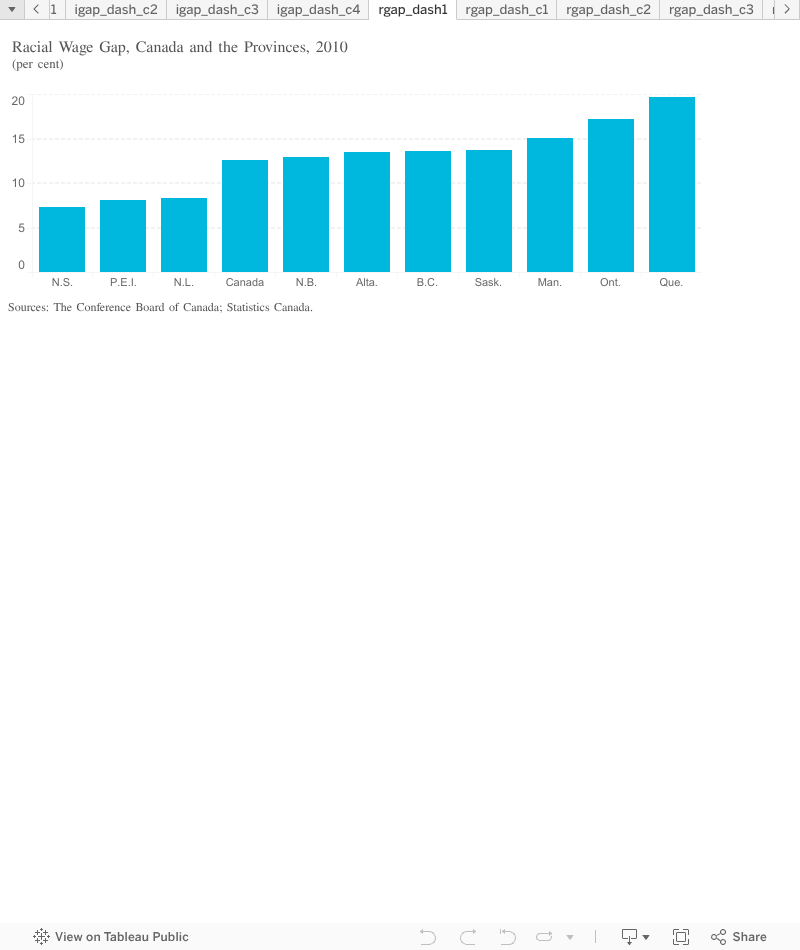
Overall, in Canada the difference in full-year, full-time median wages and salaries between university-educated Canadian-born visible minorities and Caucasians in 2010 was 12.6 per cent: the median wages and salaries of university-educated Canadian-born Caucasians was $70,196 versus $61,381 for visible minorities.4
The Atlantic provinces have the smallest racial wage gaps. At 7.3 per cent, Nova Scotia has the smallest gap in earnings. P.E.I. and Newfoundland and Labrador follow with 8.1 and 8.3 per cent gaps, respectively. The racial wage gap in New Brunswick (12.9 per cent) is slightly higher than the Canadian average.
Notably, in both P.E.I. and New Brunswick, Canadian-born visible minorities earn more than their Caucasian peers. Therefore, while there is a wage gap of 8.1 and 12.9 per cent in these provinces, respectively, it is in favour of university-educated visible minority income earners.
Alberta has a 13.5 per cent racial wage gap. B.C. (13.6 per cent) and Saskatchewan (13.7 per cent) rank just behind Alberta with slightly higher racial wage gaps.
The racial wage gap in Manitoba is 15.0 per cent.
The two most populous provinces, Ontario and Quebec, are the lowest-ranked Canadian jurisdictions, with racial gaps of 17.2 per cent and 19.7 per cent, respectively.
Does the racial wage gap vary by gender?
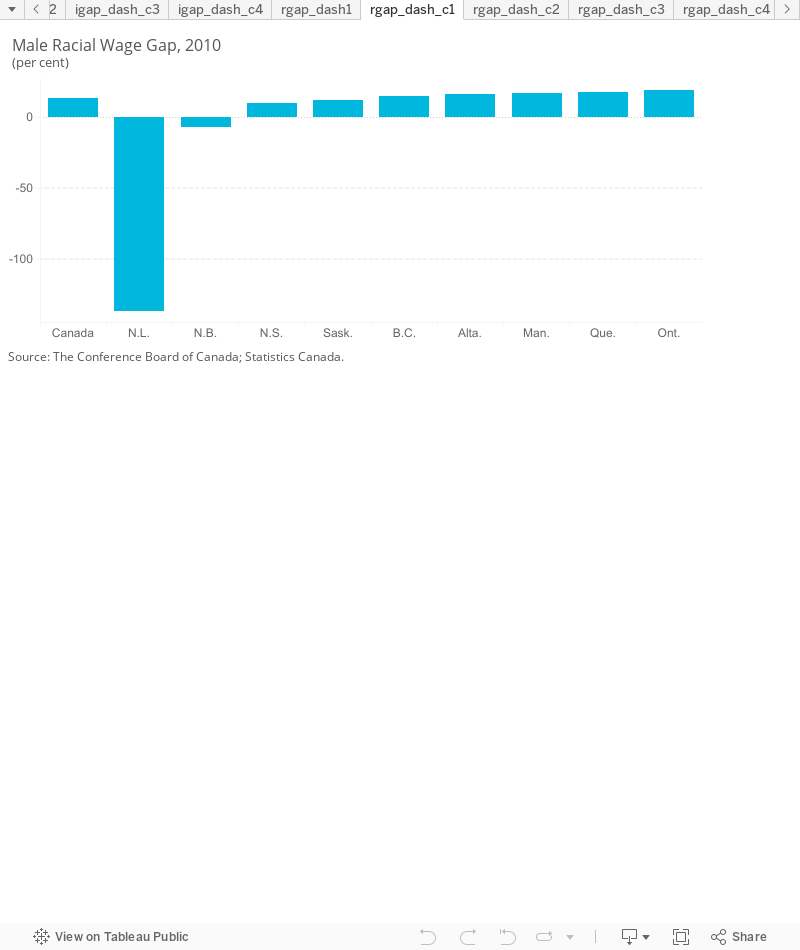
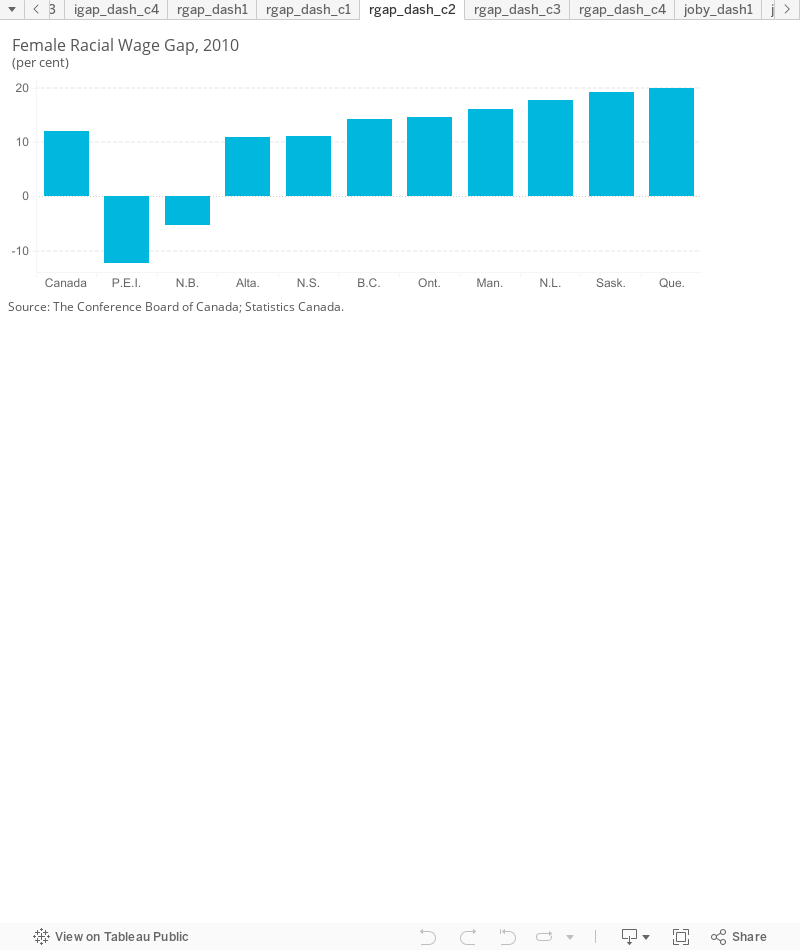
In 2010, four provinces—Ontario, Manitoba, Alberta, B.C.—had larger racial wage gaps for men than women. Four provinces—Newfoundland and Labrador, Nova Scotia, Quebec, Saskatchewan—had larger earnings gaps for women than men.
Focusing on the male racial wage gap shows the gap in earnings for visible minority men ranged from –136.5 per cent in Newfoundland and Labrador to 19.2 per cent in Ontario, with a negative value indicating the difference in earnings was in favour of Canadian-born visible minorities. (Data are unavailable for Canadian-born visible minority males in Prince Edward Island.)
The disproportionally large difference in the median full-year, full-time wages and salaries of Canadian-born Caucasians and visible minorities in Newfoundland and Labrador is a function of high median wages and salaries ($179,781) of visible minority men in the province that are likely due to high wages in the oil industry. The small sample of visible minorities (n = 135) in the province may also be a factor.
There is little difference in the relative standings of individual provinces on the racial wage gap for men versus the total population.
However, there is notable difference in the relative rank of Nova Scotia, Newfoundland and Labrador, and Ontario when the female racial wage gap is considered:
- Nova Scotia falls from first to fourth position, with a female racial wage gap of 11.19 per cent.
- Newfoundland and Labrador falls from third to eighth, with a female racial wage gap of 17.8 per cent.
- Ontario climbs from ninth to sixth, with a female racial wage gap of 14.5 per cent.
Does racial background affect the racial wage gap?
There is huge variance in the earnings gap among university-educated individuals of different racial backgrounds.
Canadian-born individuals of Japanese ethnic ancestry earned, on average, 3.7 per cent more than their Caucasian counterparts in 2010. At the other end of the spectrum, Canadian-born individuals of Latin American ancestry earned, on average, 31.7 per cent less than their Caucasian peers.
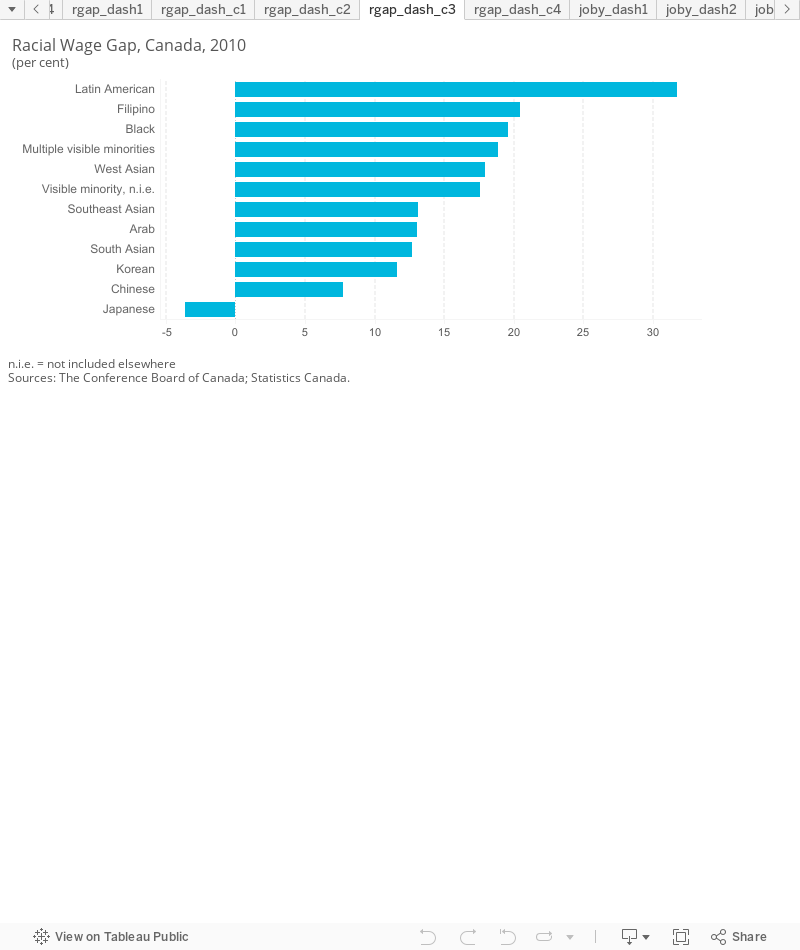
The difference in wages is most pronounced for six visible minority groups. Indeed, in 2010, university-educated Canadians who identified as:
- Latin American earned about 68.3 cents for every dollar earned by their Caucasian peers
- Filipino earned about 79.5 cents for every dollar earned by their Caucasian peers
- black earned about 80.4 cents for every dollar earned by their Caucasian peers
- multiple visible minorities earned about 81.1 cents for every dollar earned by their Caucasian peers
- West Asian (for example, individuals who reported being Afghani, Iraqi, or Iranian) earned about 82 cents for every dollar earned by their Caucasian peers
- a visible minority “not included elsewhere” (write-in survey responses such as Guyanese, West Indian, Tibetan, Polynesian, etc.) earned about 82.4 cents for every dollar earned by their Caucasian peers
Do Canadian-born visible minorities experience employment discrimination?
Employment discrimination may contribute to the racial wage gap.
Results of the 2014 General Social Survey show that Canadian-born visible minority residents of B.C., Ontario, Quebec, Manitoba, Nova Scotia, and Alberta perceived discrimination at work or when applying for a job or promotion.5
The proportion of visible minority survey respondents who reported facing employment discrimination ranged from a low of 5.3 per cent in B.C. to a high of 17.8 per cent in Alberta.
No Canadian-born visible minority residents of Newfoundland and Labrador, P.E.I., New Brunswick, or Saskatchewan responded that they had experienced discrimination because of their race or skin colour while at work or when applying for a job or promotion.
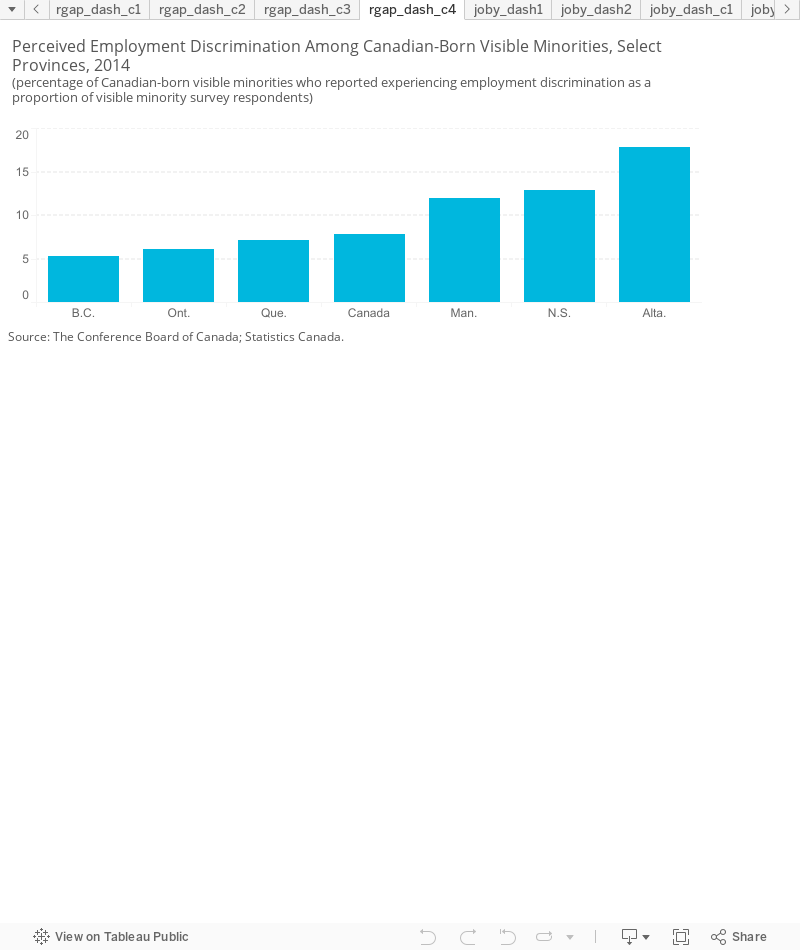
The sample sizes for this analysis were small.6 Therefore, while these results suggest that there is perceived employment discrimination among Canadian-born visible minorities in select provinces, caution must be taken not to overstate the significance of the results.
Having an ethnic-sounding name can also result in discrimination, according to a 2011 study in which resumés with the same content but different applicant names were used to examine differences in callback rates for applicants to a group of job postings based in Toronto, Montréal, and Vancouver.
The resumés were created to “plausibly represent typical immigrants that arrived recently… from China and India (top source countries for immigrants in all three cities), as well as non-immigrants with and without international sounding names.”7
The study found that resumés with English-sounding names were 35 per cent more likely to get callbacks than resumés with Indian or Chinese names.8
Racialization is also perceived as being a significant contributing factor to reduced employment security, according to a 2015 study of poverty and employment characteristics in the Greater Toronto–Hamilton Area based on the responses of 4,165 survey participants. Specifically, 20.9 per cent of Canadian-born visible minorities reported perceiving discrimination as a barrier to gaining and keeping employment—10.6 percentage points higher than their non-racialized counterparts. The study compared perceived discrimination among visible minorities with reference data for Canadian-born Caucasian males, aged 35–44, in precarious employment with individual incomes between $40,000 and $79,999.9
What can Canada and the provinces do about the racial wage gap?
The racial wage gap is not as pronounced as the immigrant wage gap in Canada and the provinces. Canadian-born working-age adults do not face many of the same barriers to employment faced by landed immigrants.
For instance, Canadian-born individuals’ participation in the Canadian educational system eliminates challenges associated with foreign qualification and skill recognition. This lessens the chances that Canadian-born visible minorities will settle into work that is misaligned with their capabilities and qualifications.
Similarly, participation in the Canadian educational system helps ensure that individuals have sufficient English and/or French language skills, the absence of which can contribute to lower earnings and higher unemployment rates.10
Nonetheless, employment and compensation barriers due to race do exist. What is more, they have a profound impact on the health and well-being of racialized Canadians and affect the nature of poverty—that is, which groups are disproportionately affected by poverty—in Canada.11
Although federal and provincial employment equity policies for both public and private sector employers exist, pay equity legislation that addresses the racial wage gap has not become as widely adopted.
While traditionally focused on eliminating differences in pay between male and female employees, pay equity policies can be extended to cover other equity groups, such as visible minorities, Indigenous people, and people with disabilities. Specifically, these polices could do the following:
- Create non-discriminatory job evaluation systems.
- Extend pay equity to cover non-unionized employees, as well as temporary and contract workers—employment conditions in which racialized groups are often overrepresented.12
- Adopt a proactive pay equity model that outline steps and timelines for achieving and maintaining pay equity in the public and private sectors.13
It is important to find ways to mitigate racial disparities and ongoing discrimination faced by visible minorities in the labour market, including increasing levels of employment and compensation. Expanding pay equity legislation is one possible strategy to eliminate the systemic wage discrimination of already vulnerable and marginalized groups and ensure that individuals receive equal pay for equal work.
Furthermore, introducing objective, transparent processes for hiring, giving feedback to, and promoting employees can help visible minorities benefit from fair employment, compensation, and advancement opportunities.
Footnotes
1 Statistics Canada, Immigration and Ethnocultural Diversity in Canada.
2 Ibid.
3 Sheila Block and Grace-Edward Galabuzi, Canada’s Colour Coded Labour Market (Ottawa: Canadian Centre for Policy Alternatives, March 2011).
4 Statistics Canada, custom order of data from 2011 National Household Survey.
5 Statistics Canada, General Social Survey, 2014.
6 B.C. (n = 5), Ontario (n = 9), Quebec (n = 4), Manitoba (n = 3), Nova Scotia (n = 4), Alberta (n = 8).
7 Philip Oreopoulos and Diane Dechief, Why Do Some Employers Prefer to Interview Matthew, but Not Samir? (Vancouver: Metropolis British Columbia Centre of Excellence for Research on Immigration and Diversity, September 2011), 19.
8 Ibid., 27.
9 Wayne Lewchuk and others, The Precarity Penalty: How Insecure Employment Disadvantages Workers and Their Families (Hamilton: PEPSO, May 2015).
10 Aneta Bonikowska, David A. Green, and W. Craig Riddell, Literacy and the Labour Market (Ottawa: Statistics Canada, 2008).
11 Sheila Block and Grace-Edward Galabuzi, Canada’s Colour Coded Labour Market (Ottawa: Canadian Centre for Policy Alternatives, March 2011).
12 Ibid.
13 House of Commons Special Committee on Pay Equity, It’s Time to Act: Report of the Special Committee on Pay Equity, June 2016.